
Page 373 - Hall et al (2015) Principles of Critical Care-McGraw-Hill
P. 373
CHAPTER 32: Assessing the Circulation: Oximetry, Indicator Dilution, and Pulse Contour Analysis 243
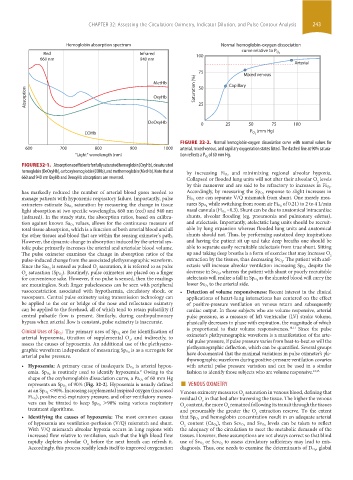
Hemoglobin absorption spectrum Normal hemoglobin-oxygen dissociation
curve relative to P
Red Infrared 100 O 2
660 nm 940 nm
Arterial
Mixed venous
MetHb Saturation (%) 75 Capillary
50
Absorption OxyHb 25
DeOxyHb 0 25 50 75 100
P (mm Hg)
COHb O 2
FIGURE 32-2. Normal hemoglobin-oxygen dissociation curve with normal values for
600 700 800 900 1000 arterial, mixed venous, and capillary oxygenation states listed. The dashed line at 90% satura-
“Light” wavelength (nm) tion reflects a P O 2 of 60 mm Hg.
FIGURE 32-1. Absorption coefficients for fully saturated hemoglobin (OxyHb), desaturated
hemoglobin (DeOxyHb), carboxyhemoglobin (COHb), and methemoglobin (MetHb). Note that at and minimizing regional alveolar hypoxia.
660 and 940 nm OxyHb and DeoxyHb absorptions are reversed. by increasing Fi O 2
Collapsed or flooded lung units will not alter their alveolar O levels
2
by this maneuver and are said to be refractory to increases in Fi O 2 .
has markedly reduced the number of arterial blood gases needed to Accordingly, by measuring the Sp O 2 response to slight increases in
manage patients with hypoxemic respiratory failure. Importantly, pulse Fi O 2 one can separate V/Q mismatch from shunt. One merely mea-
saturation by measuring the change in tissue of 0.21) to 2 to 4 L/min
oximeters estimate Sa O 2 sures Sp O 2 while switching from room air Fi O 2
light absorption at two specific wavelengths, 660 nm (red) and 940 nm nasal cannula (Fi O 2 ~0.3). Shunt can be due to anatomical intracardiac
(infrared). In the steady state, the absorption ratios, based on calibra- shunts, alveolar flooding (eg, pneumonia and pulmonary edema),
values, allows for the continuous measure of and atelectasis. Importantly, atelectatic lung units should be recruit-
tion against known Sa O 2
total tissue absorption, which is a function of both arterial blood and all able by lung expansion whereas flooded lung units and anatomical
the other tissues and blood that are within the sensing oximeter’s path. shunts should not. Thus, by performing sustained deep inspirations
However, the dynamic change in absorption induced by the arterial sys- and having the patient sit up and take deep breaths one should be
tolic pulse primarily increases the arterial and arteriolar blood volume. able to separate easily recruitable atelectasis from true shunt. Sitting
The pulse oximeter examines the change in absorption ratios of the up and taking deep breaths is a form of exercise that may increase O
2
pulse-induced change from the associated plethysmographic waveform. extraction by the tissues, thus decreasing Sv O 2 . The patient with atel-
is sensed as pulsed O saturation, it is referred to as pulse despite the
Since the Sa O 2 2 ectasis will increase alveolar ventilation increasing Sp O 2
). Routinely, pulse oximeters are placed on a finger , whereas the patient with shunt or poorly recruitable
O saturation (Sp O 2 decrease in Sv O 2
2
for convenience sake. However, if no pulse is sensed, then the readings atelectasis will realize a fall in Sp O 2 as the shunted blood will carry the
are meaningless. Such finger pulselessness can be seen with peripheral lower Sv O 2 to the arterial side.
vasoconstriction associated with hypothermia, circulatory shock, or • Detection of volume responsiveness: Recent interest in the clinical
vasospasm. Central pulse oximetry using transmission technology can applications of heart-lung interactions has centered on the effect
be applied to the ear or bridge of the nose and reflectance oximetry of positive-pressure ventilation on venous return and subsequently
can be applied to the forehead, all of which tend to retain pulsatility if cardiac output. In those subjects who are volume responsive, arterial
central pulsatile flow is present. Similarly, during cardiopulmonary pulse pressure, as a measure of left ventricular (LV) stroke volume,
bypass when arterial flow is constant, pulse oximetry is inaccurate. phasically decreases in phase with expiration, the magnitude of which
is proportional to their volume responsiveness. 10,11 Since the pulse
are for identification of
Clinical Uses of Sp O 2 : The primary uses of Sp O 2 oximeter’s plethysmographic waveform is a manifestation of the arte-
arterial hypoxemia, titration of supplemental O , and indirectly, to
2
assess the causes of hypoxemia. An additional use of the plethysmo- rial pulse pressure, if pulse pressure varies from beat-to-beat so will the
is as a surrogate for plethysmographic deflection, which can be quantified. Several groups
graphic waveform independent of measuring Sp O 2 have documented that the maximal variations in pulse oximeter’s ple-
arterial pulse pressure.
thysmographic waveform during positive-pressure ventilation covaries
is arterial hypox- with arterial pulse pressure variation and can be used in a similar
• Hypoxemia: A primary cause of inadequate D O 2
is routinely used to identify hypoxemia. Owing to the fashion to identify those subjects who are volume responsive. 12,13
9
emia. Sp O 2
of 60 mm Hg
shape of the oxyhemoglobin dissociation curve, a Pa O 2 ■
of 90% (Fig. 32-2). Hypoxemia is usually defined VENOUS OXIMETRY
represents an Sp O 2
<90%. Increasing supplemental inspired oxygen (increased
as an Sp O 2 Venous oximetry measures O saturation in venous blood, defining that
), positive end-expiratory pressure, and other ventilatory maneu- 2
Fi O 2 residual O in that bed after traversing the tissue. The higher the venous
>90% using various respiratory 2
vers can be titrated to keep Sp O 2 O content, the more O remained following its transit through the tissues
2
2
treatment algorithms. and presumably the greater the O extraction reserve. To the extent
2
• Identifying the causes of hypoxemia: The most common causes that Sp O 2 and hemoglobin concentration result in an adequate arterial
of hypoxemia are ventilation-perfusion (V/Q) mismatch and shunt. O content (Ca O 2 ), then Scv O 2 and Sv O 2 levels can be taken to reflect
2
With V/Q mismatch alveolar hypoxia occurs in lung regions with the adequacy of the circulation to meet the metabolic demands of the
increased flow relative to ventilation, such that the high blood flow tissues. However, these assumptions are not always correct so that blind
rapidly depletes alveolar O before the next breath can refresh it. use of Sv O 2 or Scv O 2 to assess circulatory sufficiency may lead to mis-
2
Accordingly, this process readily lends itself to improved oxygenation diagnosis. Thus, one needs to examine the determinants of D O 2 , global
section03.indd 243 1/23/2015 2:06:48 PM