
Page 376 - Hall et al (2015) Principles of Critical Care-McGraw-Hill
P. 376
246 PART 3: Cardiovascular Disorders
33
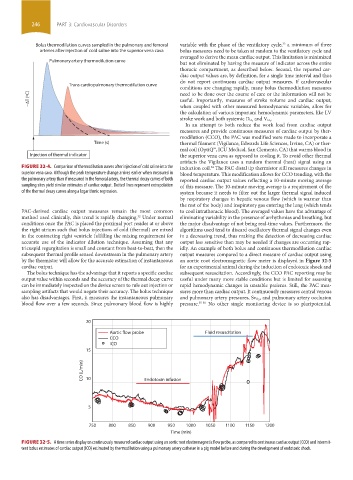
Bolus thermodilution curves sampled in the pulmonary and femoral variable with the phase of the ventilatory cycle, a minimum of three
arteries after injection of cold saline into the superior vena cava bolus measures need to be taken at random to the ventilatory cycle and
averaged to derive the mean cardiac output. This limitation is minimized
Pulmonary artery thermodilution curve
but not eliminated by having the measure of indicator across the entire
thoracic compartment, as described below. Second, the reported car-
diac output values are, by definition, for a single time interval and thus
do not report continuous cardiac output measures. If cardiovascular
Trans cardiopulmonary thermodilution curve
conditions are changing rapidly, many bolus thermodilution measures
need to be done over the course of care or the information will not be
− T (ºC) useful. Importantly, measures of stroke volume and cardiac output,
when coupled with other measured hemodynamic variables, allow for
the calculation of various important hemodynamic parameters, like LV
.
stroke work and both systemic D O 2 and V O 2
In an attempt to both reduce the work load from cardiac output
measures and provide continuous measures of cardiac output by ther-
modilution (CCO), the PAC was modified were made to incorporate a
Time (s) thermal filament (Vigilance, Edwards Life Sciences, Irvine, CA) or ther-
mal coil (OptiQ™, ICU Medical, San Clemente, CA) that warms blood in
Injection of thermal indicator the superior vena cava as opposed to cooling it. To avoid other thermal
artifacts the Vigilance uses a random thermal (heat) signal using an
FIGURE 32-4. Comparison of thermodilution curves after injection of cold saline into the induction coil. The PAC distal tip thermistor still measures changes in
34
superior vena cava. Although the peak temperature change arrives earlier when measured in blood temperature. This modification allows for CCO trending, with the
the pulmonary artery than if measured in the femoral artery, the thermal decay curves of both reported cardiac output values reflecting a 10-minute moving average
sampling sites yield similar estimates of cardiac output. Dotted lines represent extrapolation of this measure. The 10-minute moving average is a requirement of the
of the thermal decay curves along a logarithmic regression. system because it needs to filter out the larger thermal signal induced
by respiratory changes in hepatic venous flow (which is warmer than
the rest of the body) and inspiratory gas entering the lung (which tends
PAC-derived cardiac output measures remain the most common to cool intrathoracic blood). The averaged values have the advantage of
method used clinically, this trend is rapidly changing. Under normal eliminating variability in the presence of arrhythmias and breathing, but
32
conditions once the PAC is placed the proximal port resides at or above the major disadvantage of not being real-time values. Furthermore, the
the right atrium such that bolus injections of cold (thermal) are mixed algorithms used tend to discard oscillatory thermal signal changes even
in the contracting right ventricle fulfilling the mixing requirement for in a decreasing trend, thus making the detection of decreasing cardiac
accurate use of the indicator dilution technique. Assuming that any output less sensitive than may be needed if changes are occurring rap-
tricuspid regurgitation is small and constant from beat-to-beat, then the idly. An example of both bolus and continuous thermodilution cardiac
subsequent thermal profile sensed downstream in the pulmonary artery output measures compared to a direct measure of cardiac output using
by the thermistor will allow for the accurate estimation of instantaneous an aortic root electromagnetic flow meter is displayed in Figure 32-5
cardiac output. for an experimental animal during the induction of endotoxic shock and
The bolus technique has the advantage that it reports a specific cardiac subsequent resuscitation. Accordingly, the CCO PAC reporting may be
output value within seconds and the accuracy of the thermal decay curve useful under many more stable conditions but is limited for assessing
can be immediately inspected on the device screen to rule out injection or rapid hemodynamic changes in unstable patients. Still, the PAC mea-
sampling artifacts that would negate their accuracy. The bolus technique sures more than cardiac output. It continuously measures central venous
also has disadvantages. First, it measures the instantaneous pulmonary and pulmonary artery pressures, Sv O 2 , and pulmonary artery occlusion
blood flow over a few seconds. Since pulmonary blood flow is highly pressure. 35-38 No other single monitoring device is so pluripotential.
20
Aortic flow probe Fluid resuscitation
CCO
ICO
15
CO (L/min) 10 Endotoxin infusion
5
750 800 850 900 950 1000 1050 1100 1150 1200
Time (min)
FIGURE 32-5. A time series display on continuously measured cardiac output using an aortic root electromagnetic flow probe, as compared to continuous cardiac output (CCO) and intermit-
tent bolus estimates of cardiac output (ICO) estimated by thermodilution using a pulmonary artery catheter in a pig model before and during the development of endotoxic shock.
section03.indd 246 1/23/2015 2:06:51 PM