
Page 377 - Hall et al (2015) Principles of Critical Care-McGraw-Hill
P. 377
CHAPTER 32: Assessing the Circulation: Oximetry, Indicator Dilution, and Pulse Contour Analysis 247
Regrettably, the documentation that PAC use improves outcomes is estimate of lung water, has not been shown to aid in reducing time on
generally lacking, 34,39 even though such evidence is also lacking for the ventilator in patients with acute lung injury. Given that it is difficult
7 and arterial pressure monitoring. However, given the to document the benefit from all the physiological data coming from a
the use of Sp O 2
present climate in critical care medicine, it is highly doubtful that such a PAC in critically ill patients, this lack of proven benefit of these newer
study will now be undertaken. 32 measures is not surprising.
tion, several devices use the transthoracic approach to calibrate their ■ ARTERIAL PULSE CONTOUR ANALYSIS AND CARDIAC OUTPUT
Transpulmonary Indicator Dilution: In an attempt to avoid PAC inser-
cardiac output monitoring devices and also provide an independent The primary determinants of the arterial pulse pressure are LV stroke
reference cardiac output value. Since these devices measure indicator volume and central arterial compliance. Compliance is a function of
dilution over a larger capacitor than the PAC, they tend to see less size, age, sex, and physiological inputs, like sympathetic tone, hypogly-
respiratory variations in their measures, but do not eliminate them. cemia, temperature, and autonomic responsiveness of the vasculature.
40
The PiCCO™ (Pulsion Medical Systems, Munich, Germany) and the Many of these determinants of vascular compliance can be assumed
VolumeView (Edwards Life Sciences) systems use cold bolus injec- based on autopsy studies. Hamilton and Remington explored this
42
43
tions into a central vein with thermal sampling in a large peripheral interaction over 50 years ago developing the overall approach used by
artery. At least for the PiCCO device, this serves to calibrate the most of the companies who attempt to report cardiac output from the
arterial pulse contour method used for continuous cardiac output arterial pulse. The general formulas common to all these approaches that
estimations. Both the PiCCO and VolumeView systems require a attempt to estimate cardiac output from the arterial pulse signal, which
femoral artery catheter because the thermal signal needs to be mea- through microprocessor speed can be instantaneously and continuously
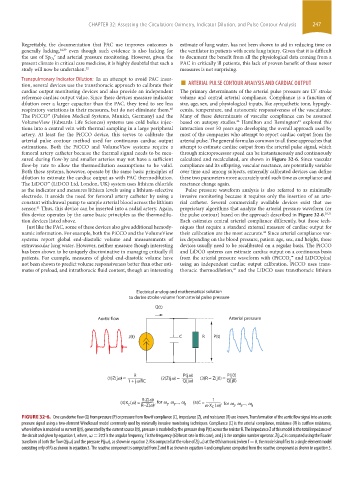
sured during flow-by and smaller arteries may not have a sufficient calculated and recalculated, are shown in Figure 32-6. Since vascular
flow-by rate to allow the thermodilution assumptions to be valid. compliance and its offspring, vascular reactance, are potentially variable
Both these systems, however, operate by the same basic principles of over time and among subjects, externally calibrated devices can define
dilution to estimate the cardiac output as with PAC thermodilution. these two parameters more accurately until such time as compliance and
The LiDCO™ (LiDCO Ltd, London, UK) system uses lithium chloride reactance change again.
as the indicator and measures lithium levels using a lithium-selective Pulse pressure waveform analysis is also referred to as minimally
electrode. It avoids the need for femoral artery catheter by using a invasive monitoring because it requires only the insertion of an arte-
constant withdrawal pump to sample arterial blood across the lithium rial catheter. Several commercially available devices exist that use
sensor. Thus, this device can be inserted into a radial artery. Again, proprietary algorithms that analyze the arterial pressure waveform (or
41
this device operates by the same basic principles as the thermodilu- the pulse contour) based on the approach described in Figure 32-6. 29,31
tion devices listed above. Each estimates central arterial compliance differently, but those tech-
Just like the PAC, some of these devices also give additional hemody- niques that require a standard external measure of cardiac output for
namic information. For example, both the PiCCO and the VolumeView their calibration are the most accurate. Since arterial compliance var-
44
systems report global end-diastolic volume and measurements of ies depending on the blood pressure, patient age, sex, and height, these
extravascular lung water. However, neither measure though interesting devices usually need to be recalibrated on a regular basis. The PiCCO
has been shown to be uniquely discriminative in managing critically ill and LiDCO systems can estimate cardiac output on a continuous basis
patients. For example, measures of global end-diastolic volume have from the arterial pressure waveform with (PiCCO ™ and LiDCOplus)
2
not been shown to predict volume responsiveness better than other esti- using an independent cardiac output calibration. PiCCO uses trans-
mates of preload, and intrathoracic fluid content, though an interesting thoracic thermodilution, and the LiDCO uses transthoracic lithium
45
Electrical analog and mathematical solution
to derive stroke volume from arterial pulse pressure
Q(t)
Aortic flow Arterial pressure
J(t) C R P(t)
R P(jw) P(j0)
(1)Z(jw) = (2)Z(jw) = (3)R = Z(j0) =
1 + jw RC Q(jw) Q(j0)
R·Z(w) 1
(4)X (w) = R−Z(w)’ for w , w ,..., w 8 (5)C = w·X C (w)’ for w , w ,..., w 8
2
3
C
2
3
FIGURE 32-6. One can derive flow (Q) from pressure (P) or pressure from flow if compliance (C), impedance (Z), and resistance (R) are known. Transformation of the aortic flow signal into an aortic
pressure signal using a two-element Windkessel model commonly used by minimally invasive monitoring techniques. Compliance (C) is the arterial compliance, resistance (R) is outflow resistance,
where inflow is modeled as current Q(t), generated by the current source J(t), pressure is modeled by the pressure drop P(t) across the resistor R. The impedance Z of this model is the total impedance of
the circuit and given by equation 1, where, ω = 2πf is the angular frequency, f is the frequency (60/heart rate in this case), and j is the complex number operator. Z(jω) is computed using the Fourier
transform of both the flow Q(jω) and the pressure P(jω), as shown in equation 2. R is computed at the value of Z(jω) at the 0th harmonic (when f = 0, the model simplifies to a single element model
consisting only of R) as shown in equation 3. The reactive component is computed from Z and R as shown in equation 4 and compliance computed from the reactive component as shown in equation 5.
section03.indd 247 1/23/2015 2:06:51 PM