
Page 401 - Hall et al (2015) Principles of Critical Care-McGraw-Hill
P. 401
CHAPTER 35: Ventricular Dysfunction in Critical Illness 271
150 150
Normal initial contractility
100 and afterload 100
LV Pressure LV Pressure Low initial
contractility
50 Afterload decreased 50
Afterload decreased
0 0
0 50 100 150 0 50 100 150
12 12
10 10
Cardiac output 8 6 4 Afterload decreased Cardiac output 8 Afterload decreased
6
Normal initial contractility
2 4 Low initial
2
contractility
0 0
–5 0 5 10 15 20 25 –5 0 5 10 15 20 25
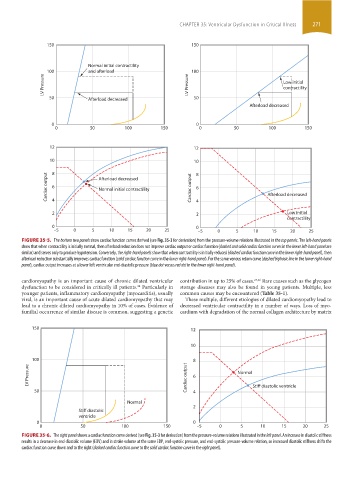
FIGURE 35-5. The bottom two panels show cardiac function curves derived (see Fig. 35-3 for derivation) from the pressure-volume relations illustrated in the top panels. The left-hand panels
show that when contractility is initially normal, then afterload reduction does not improve cardiac output or cardiac function (dashed and solid cardiac function curves in the lower left-hand panel are
similar) and serves only to produce hypotension. Conversely, the right-hand panels show that when contractility is initially reduced (dashed cardiac function curve in the lower right-hand panel), then
afterload reduction substantially improves cardiac function (solid cardiac function curve in the lower right-hand panel). For the same venous return curve (dashed biphasic line in the lower right-hand
panel), cardiac output increases at a lower left ventricular end-diastolic pressure (blue dot versus red dot in the lower right-hand panel).
cardiomyopathy is an important cause of chronic dilated ventricular contribution in up to 25% of cases. 24,26 Rare causes such as the glycogen
dysfunction to be considered in critically ill patients. Particularly in storage diseases may also be found in young patients. Multiple, less
24
younger patients, inflammatory cardiomyopathy (myocarditis), usually common causes may be encountered (Table 35-1).
viral, is an important cause of acute dilated cardiomyopathy that may These multiple, different etiologies of dilated cardiomyopathy lead to
lead to a chronic dilated cardiomyopathy in 10% of cases. Evidence of decreased ventricular contractility in a number of ways. Loss of myo-
familial occurrence of similar disease is common, suggesting a genetic cardium with degradation of the normal collagen architecture by matrix
150 12
10
100 8
LV Pressure Cardiac output 6 Normal
50 4 Sti diastolic ventricle
Normal
2
Sti diastolic
ventricle
0 0
0 50 100 150 –5 0 5 10 15 20 25
FIGURE 35-6. The right panel shows a cardiac function curve derived (see Fig. 35-3 for derivation) from the pressure-volume relations illustrated in the left panel. An increase in diastolic stiffness
results in a decrease in end-diastolic volume (EDV) and in stroke volume at the same EDP, end-systolic pressure, and end-systolic pressure-volume relation, so increased diastolic stiffness shifts the
cardiac function curve down and to the right (dashed cardiac function curve to the solid cardiac function curve in the right panel).
section03.indd 271 1/23/2015 2:07:04 PM