
Page 450 - Hall et al (2015) Principles of Critical Care-McGraw-Hill
P. 450
320 PART 3: Cardiovascular Disorders
A B
650 650
40 40 27 27
40 650 27 650
https://kat.cr/user/tahir99/
63 45
in a patient
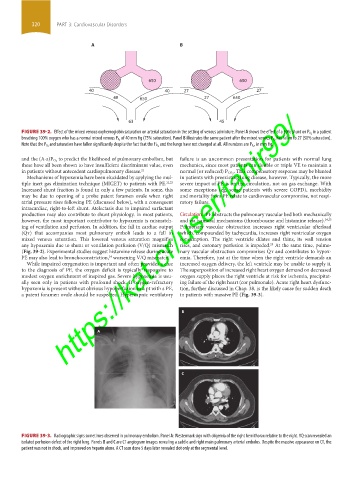
FIGURE 39-2. Effect of the mixed venous oxyhemoglobin saturation on arterial saturation in the setting of venous admixture. Panel A shows the effect of a 50% shunt on P O 2
has fallen to 27 (50% saturation).
breathing 100% oxygen who has a normal mixed venous P O 2 of 40 mm Hg (75% saturation). Panel B illustrates the same patient after the mixed venous P O 2
, in mm Hg.
Note that the P O 2 and saturation have fallen significantly despite the fact that the Fi O 2 and the lungs have not changed at all. All numbers are P O 2
to predict the likelihood of pulmonary embolism, but failure is an uncommon presentation for patients with normal lung
and the (A-a)P O 2
these have all been shown to have insufficient discriminant value, even mechanics, since most patients can double or triple VE to maintain a
in patients without antecedent cardiopulmonary disease. 21 normal (or reduced) P CO 2 . This compensatory response may be blunted
Mechanisms of hypoxemia have been elucidated by applying the mul- in patients with preexisting lung disease, however. Typically, the more
tiple inert gas elimination technique (MIGET) to patients with PE. 22,23 severe impact of PE is on the circulation, not on gas exchange. With
Increased shunt fraction is found in only a few patients. In some, this some exceptions (eg, some patients with severe COPD), morbidity
may be due to opening of a probe patent foramen ovale when right and mortality from PE relate to cardiovascular compromise, not respi-
atrial pressure rises following PE (discussed below), with a consequent ratory failure.
intracardiac, right-to-left shunt. Atelectasis due to impaired surfactant
production may also contribute to shunt physiology. In most patients, Circulation: PE obstructs the pulmonary vascular bed both mechanically
however, the most important contributor to hypoxemia is mismatch- and via humoral mechanisms (thromboxane and histamine release). 24,25
ing of ventilation and perfusion. In addition, the fall in cardiac output Pulmonary vascular obstruction increases right ventricular afterload
(Q ˙ t) that accompanies most pulmonary emboli leads to a fall in which, compounded by tachycardia, increases right ventricular oxygen
mixed venous saturation. This lowered venous saturation magnifies consumption. The right ventricle dilates and thins, its wall tension
any hypoxemia due to shunt or ventilation perfusion (V/Q) mismatch rises, and coronary perfusion is impeded. At the same time, pulmo-
25
(Fig. 39-2). Experimental studies suggest histamine release during acute nary vascular obstruction compromises Q ˙ t and contributes to hypox-
PE may also lead to bronchoconstriction, worsening V/Q mismatch. emia. Therefore, just at the time when the right ventricle demands an
24
While impaired oxygenation is important and often provides a clue increased oxygen delivery, the left ventricle may be unable to supply it.
to the diagnosis of PE, the oxygen deficit is typically responsive to The superposition of increased right heart oxygen demand on decreased
modest oxygen enrichment of inspired gas. Severe hypoxemia is usu- oxygen supply places the right ventricle at risk for ischemia, precipitat-
ally seen only in patients with profound shock. If oxygen-refractory ing failure of the right heart (cor pulmonale). Acute right heart dysfunc-
hypoxemia is present without obvious hypoperfusion in a pt with a PE, tion, further discussed in Chap. 38, is the likely cause for sudden death
a patent foramen ovale should be suspected. Hypercapnic ventilatory in patients with massive PE (Fig. 39-3).
B
A
C
FIGURE 39-3. Radiographic signs sometimes observed in pulmonary embolism. Panel A: Westermark sign with oligemia of the right hemithorax relative to the right. VQ scan revealed an
isolated perfusion defect of the right lung. Panels B and C are CT angiogram images revealing a saddle and right main pulmonary arterial embolus. Despite the massive appearance on CT, the
patient was not in shock, and improved on heparin alone. A CT scan done 5 days later revealed clot only at the segmental level.
section03.indd 320 1/23/2015 2:07:32 PM