
Page 593 - Hall et al (2015) Principles of Critical Care-McGraw-Hill
P. 593
CHAPTER 48: Ventilator Waveforms: Clinical Interpretation 413
cm H 2 O Pressure-time s l/s Flow-time s
90 1.2
0 6
0
−1.2
l/s Flow-time Flow-time
1.2
cm H O Pressure-time s
2
40
0
−1.2
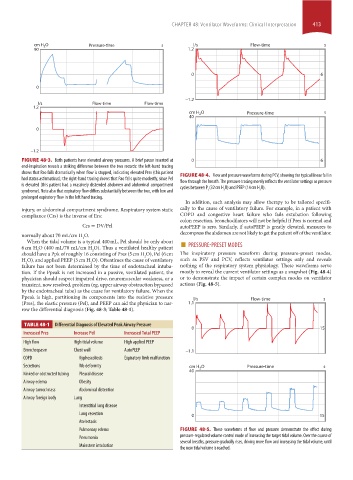
FIGURE 48-3. Both patients have elevated airway pressures. A brief pause inserted at 0 6
end-inspiration reveals a striking difference between the two records: the left-hand tracing
shows that Pao falls dramatically when flow is stopped, indicating elevated Pres (this patient FIGURE 48-4. Flow and pressure waveforms during PCV, showing the typical linear fall in
had status asthmaticus); the right-hand tracing shows that Pao falls quite modestly, since Pel flow through the breath. The pressure tracing merely reflects the ventilator settings as pressure
is elevated (this patient had a massively distended abdomen and abdominal compartment cycles between P (32 cm H O) and PEEP (14 cm H O).
syndrome). Note also that expiratory flow differs substantially between the two, with low and I 2 2
prolonged expiratory flow in the left hand tracing.
In addition, such analysis may allow therapy to be tailored specifi-
injury, or abdominal compartment syndrome. Respiratory system static cally to the cause of ventilatory failure. For example, in a patient with
compliance (Crs) is the inverse of Ers: COPD and congestive heart failure who fails extubation following
colon resection, bronchodilators will not be helpful if Pres is normal and
Crs = DV/Pel autoPEEP is zero. Similarly, if autoPEEP is greatly elevated, measures to
normally about 70 mL/cm H O. decompress the abdomen are not likely to get the patient off of the ventilator.
6 cm H O (400 mL/70 mL/cm H O). Thus a ventilated healthy patient ■ PRESSURE-PRESET MODES
2
When the tidal volume is a typical 400 mL, Pel should be only about
2
2
should have a Ppk of roughly 16 consisting of Pres (5 cm H O), Pel (6 cm The inspiratory pressure waveform during pressure-preset modes,
2
H O), and applied PEEP (5 cm H O). Oftentimes the cause of ventilatory such as PSV and PCV, reflects ventilator settings only and reveals
2
2
failure has not been determined by the time of endotracheal intuba- nothing of the respiratory system physiology. These waveforms serve
tion. If the Ppeak is not increased in a passive, ventilated patient, the mostly to reveal the current ventilator settings as a snapshot (Fig. 48-4)
physician should suspect impaired drive, neuromuscular weakness, or a or to demonstrate the impact of certain complex modes on ventilator
transient, now resolved, problem (eg, upper airway obstruction bypassed actions (Fig. 48-5).
by the endotracheal tube) as the cause for ventilatory failure. When the
Ppeak is high, partitioning its components into the resistive pressure l/s Flow-time s
(Pres), the elastic pressure (Pel), and PEEP can aid the physician to nar- 1.1
row the differential diagnosis (Fig. 48-3; Table 48-1).
TABLE 48-1 Differential Diagnosis of Elevated Peak Airway Pressure
0 15
Increased Pres Increase Pel Increased Total PEEP
High flow High tidal volume High applied PEEP
Bronchospasm Chest wall AutoPEEP −1.1
COPD Kyphoscoliosis Expiratory limb malfunction
Secretions Rib deformity cm H O Pressure-time s
2
40
Kinked or obstructed tubing Pleural disease
Airway edema Obesity
Airway tumor/mass Abdominal distention
Airway foreign body Lung
Interstitial lung disease
Lung resection 0 15
Atelectasis
Pulmonary edema FIGURE 48-5. These waveforms of flow and pressure demonstrate the effect during
Pneumonia pressure- regulated volume control mode of increasing the target tidal volume. Over the course of
several breaths, pressure gradually rises, driving more flow and increasing the tidal volume, until
Mainstem intubation the new tidal volume is reached.
section04.indd 413 1/23/2015 2:19:05 PM