
Page 603 - Hall et al (2015) Principles of Critical Care-McGraw-Hill
P. 603
CHAPTER 48: Ventilator Waveforms: Clinical Interpretation 423
UNUSUAL PROBLEMS REVEALED cm H 2 O Pressure-time s
BY WAVEFORM ANALYSIS 40
Modern ventilators allow remarkable control over many aspects of ven-
tilation beyond those related to tidal volume, rate, and PEEP. The ability
to adjust flow profiles, flow rates, and rise times gives the intensivist
tools for improving patient-ventilator synchrony and patient comfort. At
the same time, however, changing some of these parameters has unantic-
ipated consequences, many of which are revealed by comparing flow or 0 8
pressure waveforms before and after the intervention. For example, the
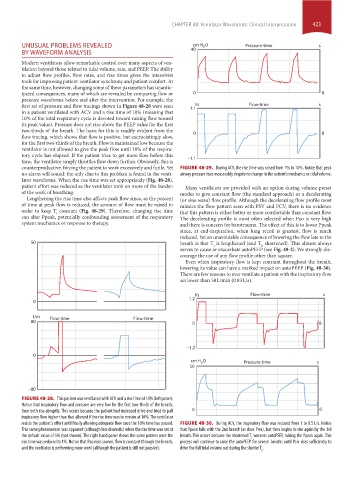
first set of pressure and flow tracings shown in Figure 48-28 were seen 1.1 l/s Flow-time s
in a patient ventilated with ACV and a rise time of 10% (meaning that
10% of the total respiratory cycle is devoted toward raising flow toward
its peak value). Pressure does not rise above the PEEP value for the first
two-thirds of the breath. The basis for this is readily evident from the
flow tracing, which shows that flow is positive, but excruciatingly slow, 0 8
for the first two-thirds of the breath. Flow is maintained low because the
ventilator is not allowed to give the peak flow until 10% of the respira-
tory cycle has elapsed. If the patient tries to get more flow before this
time, the ventilator simply throttles flow down further. Obviously, this is −1.1
counterproductive, forcing the patient to work excessively and futile. Yet FIGURE 48-29. During ACV, the rise time was raised from 1% to 10%. Notice that peak
no alarm will sound: the only clue to this problem is found in the venti- airway pressure rises measurably despite no change in the patient’s mechanics or tidal volume.
lator waveforms. When the rise time was set appropriately (Fig. 48-28),
patient effort was reduced as the ventilator took on more of the burden Many ventilators are provided with an option during volume-preset
of the work of breathing. modes to give constant flow (the standard approach) or a decelerating
Lengthening the rise time also affects peak flow since, as the percent (or sine wave) flow profile. Although the decelerating flow profile most
of time at peak flow is reduced, the amount of flow must be raised in mimics the flow pattern seen with PSV and PCV, there is no evidence
order to keep T constant (Fig. 48-29). Therefore, changing rise time that this pattern is either better or more comfortable than constant flow.
I
can alter Ppeak, potentially confounding assessment of the respiratory The decelerating profile is most often selected when Pao is very high
system mechanics or response to therapy. and there is concern for barotrauma. The effect of this is to lower Ppeak
since, at end-inspiration, when lung recoil is greatest, flow is much
reduced. Yet an unavoidable consequence of lowering the flow late in the
50 breath is that T is lengthened (and T shortened). This almost always
E
I
serves to cause or exacerbate autoPEEP (see Fig. 48-2). We strongly dis-
courage the use of any flow profile other than square.
Even when inspiratory flow is kept constant throughout the breath,
lowering its value can have a marked impact on autoPEEP (Fig. 48-30).
There are few reasons to ever ventilate a patient with the inspiratory flow
set lower than 50 L/min (0.83 L/s).
l/s Flow-time s
1.2
0
l/m Flow-time Flow-time
80 0 6
−1.2
0
cm H O Pressure-time s
2
50
−80
FIGURE 48-28. This patient was ventilated with ACV and a rise time of 10% (left panel).
Notice that inspiratory flow and pressure are very low for the first two-thirds of the breath,
then both rise abruptly. This occurs because the patient had increased drive and tried to pull 0 6
inspiratory flow higher than that allowed if the rise time was to remain at 10%. The ventilator
resists the patient’s effort until finally allowing adequate flow once the 10% time has passed. FIGURE 48-30. During ACV, the inspiratory flow was reduced from 1 to 0.5 L/s. Notice
This same phenomenon was apparent (although less dramatic) when the rise time was set at that Ppeak falls with the 2nd breath (as does Pres), but then begins to rise again by the 3rd
the default value of 5% (not shown). The right hand panel shows the same patient once the breath. This occurs because the shortened T worsens autoPEEP, raising the Ppeak again. This
E
rise time was reduced to 1%. Notice that Pao rises sooner, flow is constant through the breath, process will continue to raise the autoPEEP for several breaths until Palv rises sufficiently to
and the ventilator is performing more work (although the patient is still not passive). drive the full tidal volume out during the shorter T .
E
section04.indd 423 1/23/2015 2:19:17 PM