
Page 600 - Hall et al (2015) Principles of Critical Care-McGraw-Hill
P. 600
420 PART 4: Pulmonary Disorders
l/s Flow-time s of airflow obstruction. Adjusting the threshold for triggering PSV to off
1.5 can reduce the work of breathing. 5
Displays of inspiratory and expiratory flows can be very valuable in
detecting PVA and further assist the intensivist in modifying the mask
0 8 or ventilator to improve synchrony and comfort. Carefully observing
the patient-ventilator interaction and modifying the settings accord-
ingly requires substantial time in the first hour on the part of the
A
MD-respiratory therapist-nurse team.
−1.5
cm H 2 O Pressure-time s
30
WAVEFORMS TO FACILITATE LUNG-PROTECTION
IN ARDS
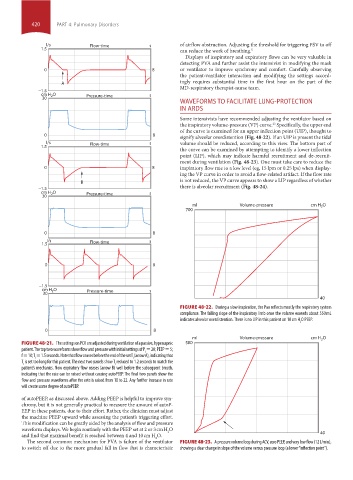
Some intensivists have recommended adjusting the ventilator based on
the inspiratory volume-pressure (VP) curve. Specifically, the upper end
23
of the curve is examined for an upper inflection point (UIP), thought to
0 8 signify alveolar overdistention (Fig. 48-22). If an UIP is present the tidal
l/s Flow-time s volume should be reduced, according to this view. The bottom part of
1.5
the curve can be examined by attempting to identify a lower inflection
point (LIP), which may indicate harmful recruitment and de-recruit-
ment during ventilation (Fig. 48-23). One must take care to reduce the
0 8 inspiratory flow rate to a low level (eg, 15 lpm or 0.25 lps) when display-
ing the VP curve in order to avoid a flow-related artifact. If the flow rate
is not reduced, the VP curve appears to show a LIP regardless of whether
B
−1.5 there is alveolar recruitment (Fig. 48-24).
cm H 2 O Pressure-time s
30
ml Volume-pressure cm H 2 O
700
0 8
l/s Flow-time s
1.5
0 8
−1.5
cm H 2 O Pressure-time s
30
40
FIGURE 48-22. During a slow inspiration, the Pao reflects mostly the respiratory system
compliance. The falling slope of the inspiratory limb once the volume exceeds about 550 mL
indicates alveolar overdistention. There is no LIP in this patient on 10 cm H O PEEP.
2
0 8
ml Volume-pressure cm H 2 O
FIGURE 48-21. The settings on PCV are adjusted during ventilation of a passive, hypercapnic 500
patient. The top two waveforms show flow and pressure with initial settings of P = 20; PEEP = 5;
I
f = 10; T = 1.5 seconds. Note that flow ceases before the end of the set T (arrow A), indicating that
I
I
T is set too long for this patient. The next two panels show T reduced to 1.2 seconds to match the
I
I
patient’s mechanics. Now expiratory flow ceases (arrow B) well before the subsequent breath,
indicating that the rate can be raised without causing autoPEEP. The final two panels show the
flow and pressure waveforms after the rate is raised from 10 to 22. Any further increase in rate
will create some degree of autoPEEP.
of autoPEEP, as discussed above. Adding PEEP is helpful to improve syn-
chrony, but it is not generally practical to measure the amount of autoP-
EEP in these patients, due to their effort. Rather, the clinician must adjust
the machine PEEP upward while assessing the patient’s triggering effort.
This modification can be greatly aided by the analysis of flow and pressure
waveform displays. We begin routinely with the PEEP set at 2 or 3 cm H O
2
and find that maximal benefit is reached between 4 and 10 cm H O. 40
2
The second common mechanism for PVA is failure of the ventilator FIGURE 48-23. A pressure volume loop during ACV, zero PEEP, and very low flow (12 L/min),
to switch off due to the more gradual fall in flow that is characteristic showing a clear change in slope of the volume versus pressure loop (a lower “inflection point”).
section04.indd 420 1/23/2015 2:19:14 PM