
Page 599 - Hall et al (2015) Principles of Critical Care-McGraw-Hill
P. 599
CHAPTER 48: Ventilator Waveforms: Clinical Interpretation 419
DEC 14 2000 Waveform monitoring Patient id 0000000000000
60
P aw
cm H 2 O
2 4 6 8 10
−20
60
.
V
LPM 2 4 6 8 10
HPL LETV 02
60 LIP FMV AIR
DEC 14 2000 Waveform monitoring Patient id 0000000000000
60
P aw
cm H 2 O
2 4 6 8 10
−20
60
.
V
LPM 2 4 6 8 10
60
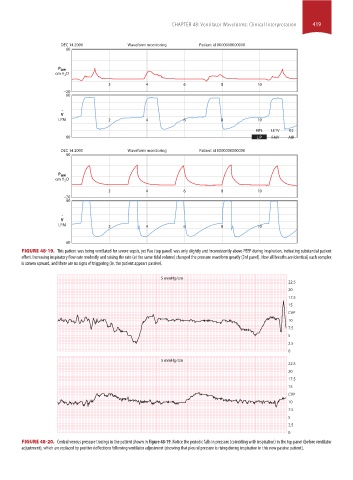
FIGURE 48-19. This patient was being ventilated for severe sepsis, yet Pao (top panel) was only slightly and inconsistently above PEEP during inspiration, indicating substantial patient
effort. Increasing inspiratory flow rate modestly and raising the rate (at the same tidal volume) changed the pressure waveform greatly (3rd panel). Now all breaths are identical, each complex
is convex upward, and there are no signs of triggering (ie, the patient appears passive).
5 mmHg/cm
22.5
20
17.5
15
CVP
10
7.5
5
2.5
0
5 mmHg/cm
22.5
20
17.5
15
CVP
10
7.5
5
2.5
0
FIGURE 48-20. Central venous pressure tracings in the patient shown in Figure 48-19. Notice the periodic falls in pressure (coinciding with inspiration) in the top panel (before ventilator
adjustment), which are replaced by positive deflections following ventilator adjustment (showing that pleural pressure is rising during inspiration in this now passive patient).
section04.indd 419 1/23/2015 2:19:12 PM