
Page 297 - Clinical Application of Mechanical Ventilation
P. 297
Monitoring in Mechanical Ventilation 263
50
40 C
B
30 End
Exhalation
20 Normal
Bronchospasm
10
A
Time © Cengage Learning 2014
Beginning
Exhalation
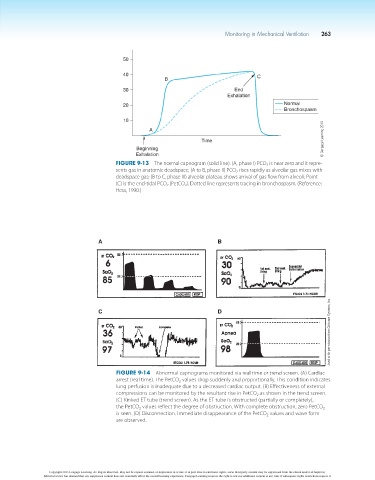
Figure 9-13 The normal capnogram (solid line). (A, phase I) PCO 2 is near zero and it repre-
sents gas in anatomic deadspace; (A to B, phase II) PCO 2 rises rapidly as alveolar gas mixes with
deadspace gas; (B to C, phase III) alveolar plateau shows arrival of gas flow from alveoli; Point
(C) is the end-tidal PCO 2 (PetCO 2 ). Dotted line represents tracing in bronchospasm. (Reference:
Hess, 1990.)
A B
Used with permission from Criticare Systems, Inc.
C D
Figure 9-14 Abnormal capnograms monitored via real time or trend screen. (A) Cardiac
arrest (real time). The PetCO 2 values drop suddenly and proportionally. This condition indicates
lung perfusion is inadequate due to a decreased cardiac output. (B) Effectiveness of external
compressions can be monitored by the resultant rise in PetCO 2 as shown in the trend screen.
(C) Kinked ET tube (trend screen). As the ET tube is obstructed (partially or completely),
the PetCO 2 values reflect the degree of obstruction. With complete obstruction, zero PetCO 2
is seen. (D) Disconnection. Immediate disappearance of the PetCO 2 values and wave form
are observed.
Copyright 2013 Cengage Learning. All Rights Reserved. May not be copied, scanned, or duplicated, in whole or in part. Due to electronic rights, some third party content may be suppressed from the eBook and/or eChapter(s).
Editorial review has deemed that any suppressed content does not materially affect the overall learning experience. Cengage Learning reserves the right to remove additional content at any time if subsequent rights restrictions require it.