Page 354 - Clinical Application of Mechanical Ventilation
P. 354

320    Chapter 11


                                                  1 sec   <3 sec  1 sec     3 sec   1 sec    3 sec    1 sec
                                                     I      E       I        E        I      E          I

                                            V (Liter)  0.8


                                            V (L/min)  50  2      4         6        8        10       12


                                                         2        4         6        8        10       12
                                            260
                                           P (cm H 2 O)  40


                                                                                                                  © Cengage Learning 2014


                                                         2        4         6        8        10       12
                                                                         Time (sec)
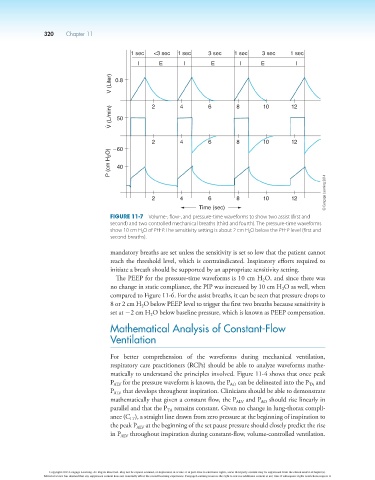
                                            Figure 11-7  Volume-, flow-, and pressure-time waveforms to show two assist (first and 
                                            second) and two controlled mechanical breaths (third and fourth). The pressure-time waveforms 
                                            show 10 cm H 2 O of PEEP. The sensitivity setting is about 2 cm H 2 O below the PEEP level (first and 
                                            second breaths).

                                            mandatory breaths are set unless the sensitivity is set so low that the patient cannot
                                            reach the threshold level, which is contraindicated. Inspiratory efforts required to
                                            initiate a breath should be supported by an appropriate sensitivity setting.
                                             The PEEP for the pressure-time waveforms is 10 cm H O, and since there was
                                                                                             2
                                            no change in static compliance, the PIP was increased by 10 cm H O as well, when
                                                                                                    2
                                            compared to Figure 11-6. For the assist breaths, it can be seen that pressure drops to
                                            8 or 2 cm H O below PEEP level to trigger the first two breaths because sensitivity is
                                                      2
                                            set at 22 cm H O below baseline pressure, which is known as PEEP compensation.
                                                         2
                                            Mathematical Analysis of Constant-Flow
                                            Ventilation


                                            For  better  comprehension  of  the  waveforms  during  mechanical  ventilation,
                                            respiratory care practitioners (RCPs) should be able to analyze waveforms mathe-
                                            matically to understand the principles involved. Figure 11-4 shows that once peak
                                            P ALV  for the pressure waveform is known, the P  can be delineated into the P  and
                                                                                   AO
                                                                                                            TA
                                            P ALV  that develops throughout inspiration. Clinicians should be able to demonstrate
                                            mathematically that given a constant flow, the P ALV  and P  should rise linearly in
                                                                                             AO
                                            parallel and that the P  remains constant. Given no change in lung-thorax compli-
                                                              TA
                                            ance (C ), a straight line drawn from zero pressure at the beginning of inspiration to
                                                  LT
                                            the peak P ALV  at the beginning of the set pause pressure should closely predict the rise
                                            in P ALV  throughout inspiration during constant-flow, volume-controlled ventilation.


                        Copyright 2013 Cengage Learning. All Rights Reserved. May not be copied, scanned, or duplicated, in whole or in part. Due to electronic rights, some third party content may be suppressed from the eBook and/or eChapter(s).
                      Editorial review has deemed that any suppressed content does not materially affect the overall learning experience. Cengage Learning reserves the right to remove additional content at any time if subsequent rights restrictions require it.
   349   350   351   352   353   354   355   356   357   358   359