
Page 352 - Clinical Application of Mechanical Ventilation
P. 352
318 Chapter 11
120 1 sec 3 sec 1 sec 3 sec 1 sec 3 sec
I E I E I E
V (L/min)
2 4 6 8 10 12
2120
P (cm H 2 O) 40
© Cengage Learning 2014
2 4 6 8 10 12
Time (sec)
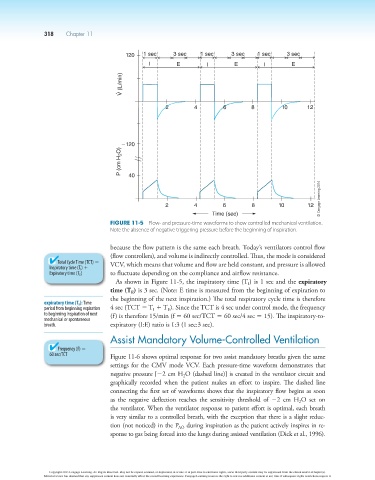
Figure 11-5 Flow- and pressure-time waveforms to show controlled mechanical ventilation.
Note the absence of negative triggering pressure before the beginning of inspiration.
because the flow pattern is the same each breath. Today’s ventilators control flow
(flow controllers), and volume is indirectly controlled. Thus, the mode is considered
Total Cycle Time (TCT) 5 VCV, which means that volume and flow are held constant, and pressure is allowed
Inspiratory time (T I ) 1
Expiratory time (T E ) to fluctuate depending on the compliance and airflow resistance.
As shown in Figure 11-5, the inspiratory time (T ) is 1 sec and the expiratory
I
time (T ) is 3 sec. (Note: E time is measured from the beginning of expiration to
E
the beginning of the next inspiration.) The total respiratory cycle time is therefore
expiratory time (T E ): Time
period from beginning expiration 4 sec (TCT 5 T 1 T ). Since the TCT is 4 sec under control mode, the frequency
I
E
to beginning inspiration of next (f) is therefore 15/min (f 5 60 sec/TCT 5 60 sec/4 sec 5 15). The inspiratory-to-
mechanical or spontaneous
breath. expiratory (I:E) ratio is 1:3 (1 sec:3 sec).
Assist Mandatory Volume-Controlled Ventilation
Frequency (f) 5
60 sec/TCT Figure 11-6 shows optimal response for two assist mandatory breaths given the same
settings for the CMV mode VCV. Each pressure-time waveform demonstrates that
negative pressure [22 cm H O (dashed line)] is created in the ventilator circuit and
2
graphically recorded when the patient makes an effort to inspire. The dashed line
connecting the first set of waveforms shows that the inspiratory flow begins as soon
as the negative deflection reaches the sensitivity threshold of 22 cm H O set on
2
the ventilator. When the ventilator response to patient effort is optimal, each breath
is very similar to a controlled breath, with the exception that there is a slight reduc-
tion (not noticed) in the P during inspiration as the patient actively inspires in re-
AO
sponse to gas being forced into the lungs during assisted ventilation (Dick et al., 1996).
Copyright 2013 Cengage Learning. All Rights Reserved. May not be copied, scanned, or duplicated, in whole or in part. Due to electronic rights, some third party content may be suppressed from the eBook and/or eChapter(s).
Editorial review has deemed that any suppressed content does not materially affect the overall learning experience. Cengage Learning reserves the right to remove additional content at any time if subsequent rights restrictions require it.