
Page 355 - Clinical Application of Mechanical Ventilation
P. 355
Ventilator Waveform Analysis 321
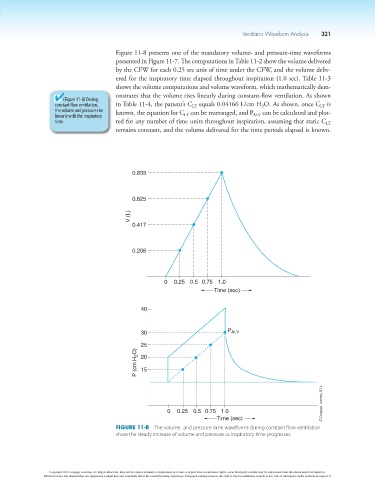
Figure 11-8 presents one of the mandatory volume- and pressure-time waveforms
presented in Figure 11-7. The computations in Table 11-2 show the volume delivered
by the CFW for each 0.25 sec unit of time under the CFW, and the volume deliv-
ered for the inspiratory time elapsed throughout inspiration (1.0 sec). Table 11-3
shows the volume computations and volume waveform, which mathematically dem-
onstrates that the volume rises linearly during constant-flow ventilation. As shown
(Figure 11-8) During
constant flow ventilation, in Table 11-4, the patient’s C equals 0.04166 L/cm H O. As shown, once C is
2
LT
LT
the volume and pressure rise known, the equation for C can be rearranged, and P can be calculated and plot-
linearly with the inspiratory LT ALV
time. ted for any number of time units throughout inspiration, assuming that static C
LT
remains constant, and the volume delivered for the time periods elapsed is known.
0.833
0.625
V (L)
0.417
0.208
0 0.25 0.5 0.75 1.0
Time (sec)
40
30 P ALV
25
P (cm H 2 O) 20
15
© Cengage Learning 2014
0 0.25 0.5 0.75 1.0
Time (sec)
Figure 11-8 The volume- and pressure-time waveforms during constant flow ventilation
show the steady increase of volume and pressure as inspiratory time progresses.
Copyright 2013 Cengage Learning. All Rights Reserved. May not be copied, scanned, or duplicated, in whole or in part. Due to electronic rights, some third party content may be suppressed from the eBook and/or eChapter(s).
Editorial review has deemed that any suppressed content does not materially affect the overall learning experience. Cengage Learning reserves the right to remove additional content at any time if subsequent rights restrictions require it.