
Page 47 - Clinical Application of Mechanical Ventilation
P. 47
Principles of Mechanical Ventilation 13
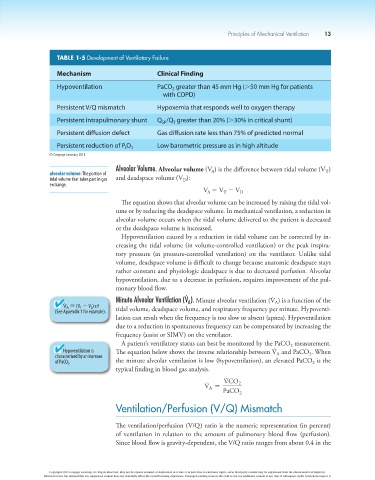
TABLE 1-5 Development of Ventilatory Failure
Mechanism Clinical Finding
Hypoventilation PaCO greater than 45 mm Hg (.50 mm Hg for patients
2
with COPD)
Persistent V/Q mismatch Hypoxemia that responds well to oxygen therapy
Persistent intrapulmonary shunt Q /Q greater than 20% (.30% in critical shunt)
T
SP
Persistent diffusion defect Gas diffusion rate less than 75% of predicted normal
Persistent reduction of P O 2 Low barometric pressure as in high altitude
I
© Cengage Learning 2014
Alveolar Volume. Alveolar volume (V ) is the difference between tidal volume (V )
alveolar volume: The portion of A T
tidal volume that takes part in gas and deadspace volume (V ):
D
exchange.
V 5 V 2 V D
T
A
The equation shows that alveolar volume can be increased by raising the tidal vol-
ume or by reducing the deadspace volume. In mechanical ventilation, a reduction in
alveolar volume occurs when the tidal volume delivered to the patient is decreased
or the deadspace volume is increased.
Hypoventilation caused by a reduction in tidal volume can be corrected by in-
creasing the tidal volume (in volume-controlled ventilation) or the peak inspira-
tory pressure (in pressure-controlled ventilation) on the ventilator. Unlike tidal
volume, deadspace volume is difficult to change because anatomic deadspace stays
rather constant and physiologic deadspace is due to decreased perfusion. Alveolar
hypoventilation, due to a decrease in perfusion, requires improvement of the pul-
monary blood flow.
# #
# Minute Alveolar Ventilation (V ). Minute alveolar ventilation (V ) is a function of the
A
A
V A 5 (V T 2 V D ) x f tidal volume, deadspace volume, and respiratory frequency per minute. Hypoventi-
(See Appendix 1 for example).
lation can result when the frequency is too slow or absent (apnea). Hypoventilation
due to a reduction in spontaneous frequency can be compensated by increasing the
frequency (assist or SIMV) on the ventilator.
A patient’s ventilatory status can best be monitored by the PaCO measurement.
#
2
Hypoventilation is The equation below shows the inverse relationship between V and PaCO . When
characterized by an increase A 2
of PaCO 2 . the minute alveolar ventilation is low (hypoventilation), an elevated PaCO is the
2
typical finding in blood gas analysis.
#
# VCO
V = 2
A
PaCO 2
Ventilation/Perfusion (V/Q) Mismatch
The ventilation/perfusion (V/Q) ratio is the numeric representation (in percent)
of ventilation in relation to the amount of pulmonary blood flow (perfusion).
Since blood flow is gravity-dependent, the V/Q ratio ranges from about 0.4 in the
Copyright 2013 Cengage Learning. All Rights Reserved. May not be copied, scanned, or duplicated, in whole or in part. Due to electronic rights, some third party content may be suppressed from the eBook and/or eChapter(s).
Editorial review has deemed that any suppressed content does not materially affect the overall learning experience. Cengage Learning reserves the right to remove additional content at any time if subsequent rights restrictions require it.