
Page 162 - Cardiac Nursing
P. 162
LWBK340-c06_p132-152.qxd 09/09/2009 08:25 AM Page 138 Aptara
138 PA R T II / Physiologic and Pathologic Responses
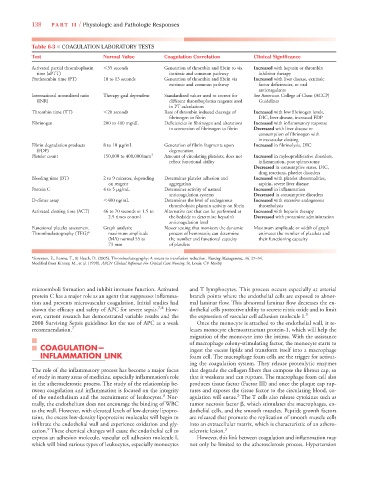
Table 6-3 ■ COAGULATION LABORATORY TESTS
Test Normal Value Coagulation Correlation Clinical Significance
Activated partial thromboplastin 35 seconds Generation of thrombin and fibrin to via Increased with heparin or thrombin
time (aPTT) intrinsic and common pathway inhibitor therapy
Prothrombin time (PT) 10 to 13 seconds Generation of thrombin and fibrin via Increased with liver disease, extrinsic
extrinsic and common pathway factor deficiencies, or oral
anticoagulants
International normalized ratio Therapy goal dependent Standardized values used to correct for See American College of Chest (ACCP)
(INR) different thromboplastin reagents used Guidelines
in PT calculations
Thrombin time (TT) 20 seconds Rate of thrombin induced cleavage of Increased with low fibrinogen levels,
fibrinogen to fibrin DIC, liver disease, increased FDP
Fibrinogen 200 to 400 mg/dL Deficiencies in fibrinogen and alterations Increased with inflammatory response
in conversion of fibrinogen to fibrin Decreased with liver disease or
consumption of fibrinogen with
intravascular clotting
Fibrin degradation products 8 to 10 g/mL Generation of fibrin fragments upon Increased in fibrinolysis, DIC
(FDP) degeneration
Platelet count 150,000 to 400,000/mm 3 Amount of circulating platelets; does not Increased in myleoproliferative disorders,
reflect functional ability inflammation, post splenectomy
Decreased in consumptive states, DIC,
drug reactions, platelet disorders
Bleeding time (BT) 2 to 9 minutes, depending Determines platelet adhesion and Increased with platelet abnormalities,
on reagent aggregation aspirin, severe liver disease
Protein C 4 to 5 g/mL Determines activity of natural Increased in inflammation
anticoagulation systems Decreased in consumptive disorders
D-dimer assay 400 ng/mL Determines the level of endogenous Increased with excessive endogenous
thrombolysis; plasmin activity on fibrin thrombolysis
Activated clotting time (ACT) 46 to 70 seconds or 1.5 to Alternative test that can be performed at Increased with heparin therapy
2.5 times control the bedside to determine heparin’s Decreased with protamine administration
anticoagulation level
Functional platelet assessment Graph analysis; Newer testing that monitors the dynamic Maximum amplitude or width of graph
Thromboelastography (TEG)* maximum amplitude process of hemostasis; can determine estimates the number of platelets and
(MA) normal 55 to the number and functional capacity their functioning capacity
73 mm of platelets
6
*Sorensen, E., Lorme, T., & Heath, D. (2005). Thromboelastography: A means to transfusion reduction. Nursing Management, 36, 27–34.
6
Modified from Kinney, M., et al. (1998). AACN Clinical Reference For Critical Care Nursing. St. Louis: CV Mosby.
g
g
microemboli formation and inhibit immune function. Activated and T lymphocytes. This process occurs especially at arterial
protein C has a major role as an agent that suppresses inflamma- branch points where the endothelial cells are exposed to abnor-
tion and prevents microvascular coagulation. Initial studies had mal laminar flow. This abnormal laminar flow decreases the en-
shown the efficacy and safety of APC for severe sepsis. 7,8 How- dothelial cells protective ability to secrete nitric oxide and to limit
ever, current research has demonstrated variable results and the the expression of vascular cell adhesion molecule I. 3
2008 Surviving Sepsis guidelines list the use of APC as a weak Once the monocyte is attached to the endothelial wall, it re-
recommendation. 7 leases monocyte chemoattractant protein-1, which will help the
migration of the monocyte into the intima. With the assistance
of macrophage colony-stimulating factor, the monocyte starts to
COAGULATION— ingest the excess lipids and transform itself into a macrophage
INFLAMMATION LINK foam cell. The macrophage foam cells are the trigger for activat-
ing the coagulation system. They release proteolytic enzymes
The role of the inflammatory process has become a major focus that degrade the collagen fibers that compose the fibrous cap, so
of study in many areas of medicine, especially inflammation’s role that it weakens and can rupture. The macrophage foam cell also
in the atherosclerostic process. The study of the relationship be- produces tissue factor (Factor III) and once the plaque cap rup-
tween coagulation and inflammation is focused on the integrity tures and exposes the tissue factor to the circulating blood, co-
3
3
of the endothelium and the recruitment of leukocytes. Nor- agulation will ensue. The T cells also release cytokines such as
mally, the endothelium does not encourage the binding of WBC tumor necrosis factor , which stimulates the macrophages, en-
to the wall. However, with elevated levels of low-density lipopro- dothelial cells, and the smooth muscles. Peptide growth factors
teins, the excess low-density lipoproteins molecules will begin to are released that promote the replication of smooth muscle cells
infiltrate the endothelial wall and experience oxidation and gly- into an extracellular matrix, which is characteristic of an athero-
9
cation. These chemical changes will cause the endothelial cell to sclerotic lesion. 3
express an adhesion molecule, vascular cell adhesion molecule I, However, this link between coagulation and inflammation may
which will bind various types of leukocytes, especially monocytes not only be limited to the atherosclerosis process. Hypertension