
Page 325 - Cardiac Nursing
P. 325
M
M
0 P
0 P
Pa
g
g
Pa
g
/29
/09
6
/29
/09
0:3
0:3
1
1
e 3
ara
a
t
ara
a
c.
c.
In
In
01
A
e 3
01
A
p
t
p
p
6
LWB
K34
LWB
30
LWBK340-c15_ p p pp300-332.qxd 6/29/09 10:30 PM Page 301 Aptara Inc.
15_
15_
0-c
K34
0-c
q
q
q
xd
xd
32.
0-3
30
32.
0-3
C HAPTER 1 5 / Electrocardiography 301
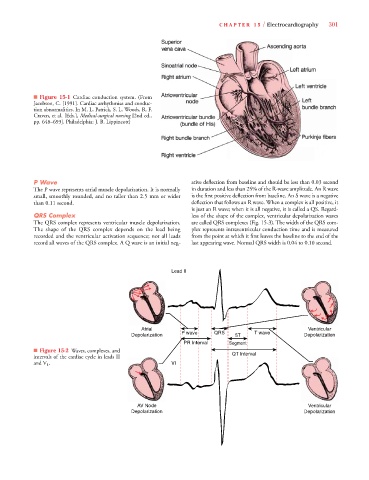
■ Figure 15-1 Cardiac conduction system. (From
Jacobson, C. [1991]. Cardiac arrhythmias and conduc-
tion abnormalities. In M. L. Patrick, S. L. Woods, R. F.
Craven, et al. [Eds.], Medical-surgical nursing [2nd ed.,
pp. 648–693]. Philadelphia: J. B. Lippincott)
P Wave ative deflection from baseline and should be less than 0.03 second
The P wave represents atrial muscle depolarization. It is normally in duration and less than 25% of the R-wave amplitude. An R wave
small, smoothly rounded, and no taller than 2.5 mm or wider is the first positive deflection from baseline. An S wave is a negative
than 0.11 second. deflection that follows an R wave. When a complex is all positive, it
is just an R wave; when it is all negative, it is called a QS. Regard-
QRS Complex less of the shape of the complex, ventricular depolarization waves
The QRS complex represents ventricular muscle depolarization. are called QRS complexes (Fig. 15-3). The width of the QRS com-
The shape of the QRS complex depends on the lead being plex represents intraventricular conduction time and is measured
recorded and the ventricular activation sequence; not all leads from the point at which it first leaves the baseline to the end of the
record all waves of the QRS complex. A Q wave is an initial neg- last appearing wave. Normal QRS width is 0.04 to 0.10 second.
Lead II
Atrial Ventricular
Depolarization P wave QRS ST T wave Depolarization
te
PR Interval Segment
■ Figure 15-2 Waves, complexes, and
e
r
intervals of the cardiac cycle in leads II QT Interval
and V 1 . VI
AV Node Ventricular
Depolarization Depolarization