
Page 327 - Cardiac Nursing
P. 327
6
6
xd
/29
e 3
e 3
/29
32.
32.
03
q
xd
q
q
g
0 P
/09
/09
0:3
1
1
0:3
Pa
g
g
Pa
0 P
M
M
03
In
In
c.
ara
a
a
c.
LWBK340-c15_
LWB
LWB K34 0-c 15_ pp300-332.qxd 6/29/09 10:30 PM Page 303 Aptara Inc.
15_
0-c
K34
ara
p
30
A
A
0-3
0-3
30
p
p
t
t
p
p
C HAPTER 1 5 / Electrocardiography 303
6 seconds
3 seconds
A
R to R
First R wave Second R wave
A 1 2 3 4 5 6 7 8 9 10
5
43
50
37
60
0
0
75
300 150 100 75 60 50 43 37 3 35 5 3030
48
33
250 136 94 71 58 48 42 37 33
37
5
94
42
58
3
71
32
56
41
69
214 125 88 69 56 47 41 36 32
1
36
88
2
47
35
65
83
39
45
187 115 83 65 54 45 39 35 31
8
15
31
54
52
62
44
38
79
31
34
0
167 107 79 62 52 44 38 34 31
6
B
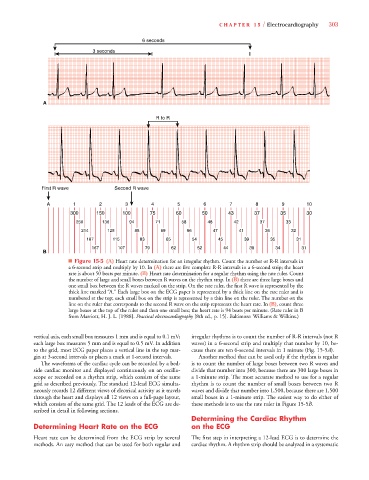
■ Figure 15-5 (A) Heart rate determination for an irregular rhythm. Count the number or R-R intervals in
a 6-second strip and multiply by 10. In (A) there are five complete R-R intervals in a 6-second strip; the heart
rate is about 50 beats per minute. (B) Heart rate determination for a regular rhythm using the rate ruler. Count
the number of large and small boxes between R waves on the rhythm strip. In (B) there are three large boxes and
one small box between the R waves marked on the strip. On the rate ruler, the first R wave is represented by the
thick line marked “A.” Each large box on the ECG paper is represented by a thick line on the rate ruler and is
numbered at the top; each small box on the strip is represented by a thin line on the ruler. The number on the
line on the ruler that corresponds to the second R wave on the strip represents the heart rate. In (B), count three
large boxes at the top of the ruler and then one small box; the heart rate is 94 beats per minute. (Rate ruler in B
from Marriott, H. J. L. [1988]. Practical electrocardiography [8th ed., p. 15]. Baltimore: Williams & Wilkins.)
vertical axis, each small box measures 1 mm and is equal to 0.1 mV; irregular rhythms is to count the number of R-R intervals (not R
each large box measures 5 mm and is equal to 0.5 mV. In addition waves) in a 6-second strip and multiply that number by 10, be-
to the grid, most ECG paper places a vertical line in the top mar- cause there are ten 6-second intervals in 1 minute (Fig. 15-5A).
gin at 3-second intervals or places a mark at 1-second intervals. Another method that can be used only if the rhythm is regular
The waveforms of the cardiac cycle can be recorded by a bed- is to count the number of large boxes between two R waves and
side cardiac monitor and displayed continuously on an oscillo- divide that number into 300, because there are 300 large boxes in
scope or recorded on a rhythm strip, which consists of the same a 1-minute strip. The most accurate method to use for a regular
grid as described previously. The standard 12-lead ECG simulta- rhythm is to count the number of small boxes between two R
neously records 12 different views of electrical activity as it travels waves and divide that number into 1,500, because there are 1,500
through the heart and displays all 12 views on a full-page layout, small boxes in a 1-minute strip. The easiest way to do either of
which consists of the same grid. The 12 leads of the ECG are de- these methods is to use the rate ruler in Figure 15-5B.
scribed in detail in following sections.
Determining the Cardiac Rhythm
Determining Heart Rate on the ECG on the ECG
Heart rate can be determined from the ECG strip by several The first step in interpreting a 12-lead ECG is to determine the
methods. An easy method that can be used for both regular and cardiac rhythm. A rhythm strip should be analyzed in a systematic