
Page 326 - Cardiac Nursing
P. 326
/09
/09
1
6
/29
/29
0 P
0 P
M
1
0:3
0:3
0-3
32.
32.
30
30
0-3
xd
xd
6
q
q
q
M
t
ara
ara
p
p
t
In
c.
c.
a
a
In
g
g
e 3
Pa
Pa
g
A
A
p
e 3
02
02
p
K34
LWB
K34
0-c
0-c
LWB
15_
p
LWBK340-c15_ pp300-332.qxd 6/29/09 10:30 PM Page 302 Aptara Inc.
15_
302 P A R T III / Assessment of Heart Disease
■ Figure 15-3 Examples of various QRS com-
plexes.
T Wave limit of normal QTc is generally considered to be 0.44 second
The T wave represents ventricular muscle repolarization. It follows in adult men and 0.45 second in adult women. 2,3,5
the QRS complex and is normally in the same direction as the QRS
complex. The T wave is usually rounded and slightly asymmetric,
rising more slowly than it descends. T waves are not normally taller BASIC ELECTROCARDIOGRAPHY
than 5 mm in any limb lead or 10 mm in any precordial lead.
The ECG is the graphic record of the electrical activity of the heart.
U Wave The spread of the electrical impulse through the heart produces
The U wave is a small, rounded wave that sometimes follows the weak electrical currents through the entire body, which can be de-
T wave and is most prominent in leads V 2 –V 4 . The U wave is tected and amplified by the ECG machine and recorded on cali-
V V
normally in the same direction as the T wave but is only approx- brated graph paper. These amplified signals form the ECG tracing,
imately 10% of its amplitude. The U wave is thought to be part consisting of the waveforms and intervals described previously, and
of the ventricular repolarization process and may represent repo- are inscribed onto grid paper that moves beneath the recording sty-
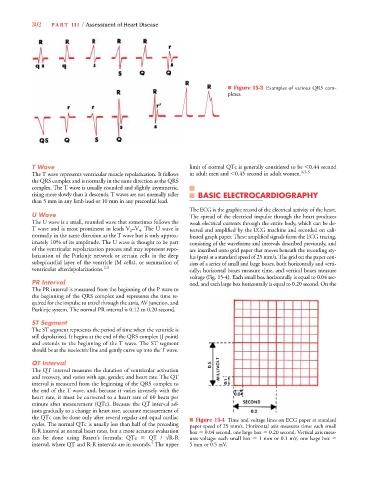
larization of the Purkinje network or certain cells in the deep lus (pen) at a standard speed of 25 mm/s. The grid on the paper con-
subepicardial layer of the ventricle (M cells), or summation of sists of a series of small and large boxes, both horizontally and verti-
ventricular afterdepolarizations. 2,3 cally; horizontal boxes measure time, and vertical boxes measure
voltage (Fig. 15-4). Each small box horizontally is equal to 0.04 sec-
PR Interval ond, and each large box horizontally is equal to 0.20 second. On the
The PR interval is measured from the beginning of the P wave to
the beginning of the QRS complex and represents the time re-
quired for the impulse to travel through the atria, AV junction, and
Purkinje system. The normal PR interval is 0.12 to 0.20 second.
ST Segment
The ST segment represents the period of time when the ventricle is
still depolarized. It begins at the end of the QRS complex (J point)
and extends to the beginning of the T wave. The ST segment
should be at the isoelectric line and gently curve up into the T wave.
QT Interval
The QT interval measures the duration of ventricular activation
and recovery, and varies with age, gender, and heart rate. The QT
interval is measured from the beginning of the QRS complex to
the end of the T wave, and, because it varies inversely with the
heart rate, it must be corrected to a heart rate of 60 beats per
minute after measurement (QTc). Because the QT interval ad-
justs gradually to a change in heart rate, accurate measurement of
the QTc can be done only after several regular and equal cardiac ■ Figure 15-4 Time and voltage lines on ECG paper at standard
cycles. The normal QTc is usually less than half of the preceding paper speed of 25 mm/s. Horizontal axis measures time: each small
R-R interval at normal heart rates, but a more accurate evaluation box 0.04 second, one large box 0.20 second. Vertical axis meas-
can be done using Bazett’s formula: QTc QT / √R-R ures voltage: each small box 1 mm or 0.1 mV, one large box
4
interval, where QT and R-R intervals are in seconds. The upper 5 mm or 0.5 mV.