Page 452 - Cardiac Nursing
P. 452

38.
                                             M
                           qxd
                                               P
                                                  e 4
                                                 g
                                               P
                                           7 A
                       0-4
                                9/0
                               0
                    p42
                                        8:2
                                    009
                                  9/2
                                                    28
               0-c
            K34
                         38.
                 19_
         LWB
         LWB K34 0-c 19_ p42 0-4 38. qxd  0 9/0 9/2 009  0 0 8:2 7 A M  P a a g e 4 28  Apt ara
            K34
         LWBK340-c19_19_p420-438.qxd  09/09/2009  08:27 AM  Page 428 Aptara
                                                    28
                                                       Apt
                                                         ara
                  428    P A R T  III / Assessment of Heart Disease
                       20                                   0              20                                  0
                       25                                   1              25                                  1
                       30                                   2              30                           20     2
                                                       20
                       35                                   3              35               Sedentary  30  20  3
                                                     30
                       40                                   4              40                        40  30    4
                                                    40
                       45                                   5              45                      50   40     5
                                                  50                                              60
                       50                        60         6              50                    70  60 50  Active  6
                     Age  55                   80 70        7   Mets     Age  55             100 90 80  70     7    Mets
                       60                     90            8              60                110   80          8
                                                                                            120
                                             1 100                                         130    90
                                                                                                 100
                                             110
                       65                   120             9              65             140   110            9
                                           130                                            150  120
                                                                                               1
                       70                  140              10             70                  130             10
                                          150                                                 140
                       75                                   11             75                150               11
                       80                                   12             80                                  12
                       85                                   13             85                                  13
                       90                                   14             90                                  14
                                                            15                                                 15
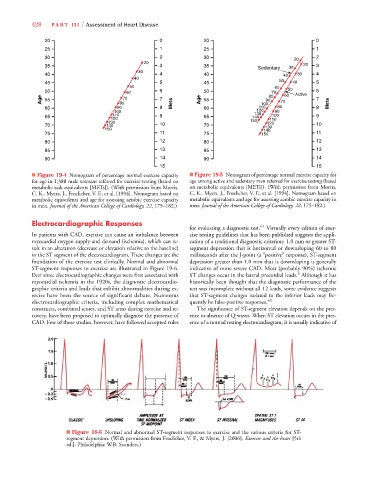
                  ■ Figure 19-4 Nomogram of percentage normal exercise capacity  ■ Figure 19-5 Nomogram of percentage normal exercise capacity for
                  for age in 1,388 male veterans referred for exercise testing (based on  age among active and sedentary men referred for exercise testing (based
                  metabolic task equivalents [METs]). (With permission from Morris,  on metabolic equivalents [METs]). (With permission from Morris,
                  C. K., Myers, J., Froelicher, V. F., et al. [1994]. Nomogram based on  C.K., Myers, J., Froelicher, V. F., et al. [1994]. Nomogram based on
                  metabolic equivalents and age for assessing aerobic exercise capacity  metabolic equivalents and age for assessing aerobic exercise capacity in
                  in men. Journal of the American College of Cardiology, 22, 175–182.)  men. Journal of the American College of Cardiology, 22, 175–182.)
                  Electrocardiographic Responses                                             61
                                                                      for evaluating a diagnostic test.  Virtually every edition of exer-
                  In patients with CAD, exercise can cause an imbalance between  cise testing guidelines that has been published suggests the appli-
                  myocardial oxygen supply and demand (ischemia), which can re-  cation of a traditional diagnostic criterion: 1.0 mm or greater ST-
                  sult in an alteration (decrease or elevation relative to the baseline)  segment depression that is horizontal or downsloping 60 to 80
                  in the ST segment of the electrocardiogram. These changes are the  milliseconds after the J-point (a “positive” response). ST-segment
                  foundation of the exercise test clinically. Normal and abnormal  depression greater than 1.0 mm that is downsloping is generally
                  ST-segment responses to exercise are illustrated in Figure 19-6.  indicative of more severe CAD. Most (probably 90%) ischemic
                                                                                                         4
                  Ever since electrocardiographic changes were first associated with  ST changes occur in the lateral precordial leads. Although it has
                  myocardial ischemia in the 1920s, the diagnostic electrocardio-  historically been thought that the diagnostic performance of the
                  graphic criteria and leads that exhibit abnormalities during ex-  test was incomplete without all 12 leads, some evidence suggests
                  ercise have been the source of significant debate. Numerous  that ST-segment changes isolated to the inferior leads may fre-
                  electrocardiographic criteria, including complex mathematical  quently be false-positive responses. 62
                  constructs, combined scores, and ST areas during exercise and re-  The significance of ST-segment elevation depends on the pres-
                  covery, have been proposed to optimally diagnose the presence of  ence or absence of Q waves. When ST elevation occurs in the pres-
                  CAD. Few of these studies, however, have followed accepted rules  ence of a normal resting electrocardiogram, it is usually indicative of


                              ■ Figure 19-6 Normal and abnormal ST-segment responses to exercise and the various criteria for ST-
                              segment depression. (With permission from Froelicher, V. F., & Myers, J. [2006]. Exercise and the heart [5th
                              ed.]. Philadelphia: W.B. Saunders.)
   447   448   449   450   451   452   453   454   455   456   457