
Page 453 - Cardiac Nursing
P. 453
9/0
0
9/2
8:2
009
0-4
p42
38.
qxd
38.
29
e 4
29
ara
Apt
M
7 A
P
g
P
LWBK340-c19_19_p420-438.qxd 09/09/2009 08:27 AM Page 429 Aptara
L L LWB
LWB K34 0-c 19_ p42 0-4 38. qxd 0 9/0 9/2 009 0 0 8:2 7 A M P a a g e 4 29 Apt ara
K34
K34
0-c
19_
C HAPTER 1 9 / Exercise Testing 429
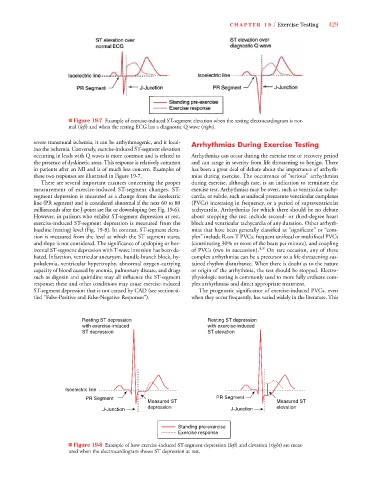
■ Figure 19-7 Example of exercise-induced ST-segment elevation when the resting electrocardiogram is nor-
mal (left) and when the resting ECG has a diagnostic Q wave (right).
t
t
t
t
severe transmural ischemia, it can be arrhythmogenic, and it local- Arrhythmias During Exercise Testing
izes the ischemia. Conversely, exercise-induced ST-segment elevation
occurring in leads with Q waves is more common and is related to Arrhythmias can occur during the exercise test or recovery period
the presence of dyskinetic areas. This response is relatively common and can range in severity from life threatening to benign. There
in patients after an MI and is of much less concern. Examples of has been a great deal of debate about the importance of arrhyth-
these two responses are illustrated in Figure 19-7. mias during exercise. The occurrence of “serious” arrhythmias
There are several important nuances concerning the proper during exercise, although rare, is an indication to terminate the
measurement of exercise-induced ST-segment changes. ST- exercise test. Arrhythmias may be overt, such as ventricular tachy-
segment depression is measured as a change from the isoelectric cardia, or subtle, such as unifocal premature ventricular complexes
line (PR segment) and is considered abnormal if the next 60 to 80 (PVCs) increasing in frequency, or a period of supraventricular
milliseconds after the J-point are flat or downsloping (see Fig. 19-6). tachycardia. Arrhythmias for which there should be no debate
However, in patients who exhibit ST-segment depression at rest, about stopping the test include second- or third-degree heart
exercise-induced ST-segment depression is measured from the block and ventricular tachycardia of any duration. Other arrhyth-
baseline (resting) level (Fig. 19-8). In contrast, ST-segment eleva- mias that have been generally classified as “significant” or “com-
tion is measured from the level at which the ST segment starts, plex” include R-on-T PVCs, frequent unifocal or multifocal PVCs
and slope is not considered. The significance of upsloping or hor- (constituting 30% or more of the beats per minute), and coupling
izontal ST-segment depression with T-wave inversion has been de- of PVCs (two in succession). 4,8 On rare occasion, any of these
bated. Infarction, ventricular aneurysm, bundle-branch block, hy- complex arrhythmias can be a precursor to a life-threatening sus-
pokalemia, ventricular hypertrophy, abnormal oxygen-carrying tained rhythm disturbance. When there is doubt as to the nature
capacity of blood caused by anemia, pulmonary disease, and drugs or origin of the arrhythmia, the test should be stopped. Electro-
such as digoxin and quinidine may all influence the ST-segment physiologic testing is commonly used to more fully evaluate com-
response; these and other conditions may cause exercise-induced plex arrhythmias and direct appropriate treatment.
ST-segment depression that is not caused by CAD (see section ti- The prognostic significance of exercise-induced PVCs, even
tled “False-Positive and False-Negative Responses”). when they occur frequently, has varied widely in the literature. This
Resting ST depression Resting ST depression
with exercise-induced with exercise-induced
ST depression ST elevation
Isoelectric line
PR Segment PR Segment
Measured ST Measured ST
depression elevation
J-Junction J-Junction
Standing pre-exercise
Exercise response
t
t
■ Figure 19-8 Example of how exercise-induced ST-segment depression (left) and elevation (t t right) are meas-
ured when the electrocardiogram shows ST depression at rest.