
Page 68 - ACCCN's Critical Care Nursing
P. 68
Quality and Safety 45
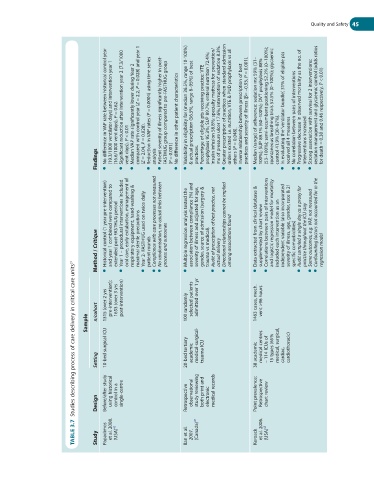
(19.3/1000 ventilator days) and Intervention year 1 No difference in VAP rate between historical control year (16.6/1000 vent days), P = 0.62. Significant reduction after Intervention year 2 (7.3/1000 Median VAP rate significantly lower during Year 2 compared with control year (Z = 2.2, P = 0.028) and year 1 Reduction in VAP rates (P = 0.0004) using time series Patient severity of illness significantly higher in post- FASTHUG group compare
Findings ● ● vent days), P < 0.01 ● (Z = 2.04, P = 0.028). ● analysis ● (P = 0.001) ● ● practices. ● ● others (P = 0.048). ● ● control 41.9% (30–87%). ● received all 4 measures ● ● interventions increased ●
Historical control (1 year pre-intervention) and year 1 combined were compared to extended post-FASTHUG period Year 1 – procedural interventions included oral care, early extubation, management of respiratory equipment, hand-washing & Year 2- FASTHUG used on twice daily Compliance with care processes not measured No randomisation, no causal links between Multiple regression analysis tested the association between compliance (%) and sever
Method / Critique ● ● maximal sterile precautions ● patient rounds ● ● process and outcomes ● trauma vs medical). ● actual delivery ● among associations found ● ● specific comorbidities) ● ● ● regression model
Studies describing process of care delivery in critical care units 57
n/cohort 1315 (over 2 yrs pre-intervention); 1653 (over 3 yrs post-intervention) 100 randomly selected patients admitted over 1 yr 1463 cases, mech. vent >96 hours
Sample
Setting 10-bed surgical ICU 20-bed tertiary academic medical-surgical- trauma ICU 38 academic medical centres – 114 ICUs of 15 types (65% medical, surgical, cardiac, cardiothoracic)
Before/after study using historical control in a single-centre Retrospective observational study reviewing both print and electronic medical records Point prevalence; Retrospective chart review
Design
TABLE 3.7 Study Papadimos et al. 2008. (USA) 42 Ilan et al. 2007. (Canada) 47 Keroack et al. 2006. (USA) 45