
Page 1271 - Hematology_ Basic Principles and Practice ( PDFDrive )
P. 1271
Chapter 69 Essential Thrombocythemia 1117
1.00 1.00
Overall survival (proportion) 0.50 ET Leukemia-free survival (proportion) 0.50 ET
0.75
0.75
Early or prefibrotic PMF
Early or prefibrotic PMF
0.25
0.25
0
0 P < .001 10 15 20 0 0 P < .001 10 15 20
5
5
Time since diagnosis (yr) Time since diagnosis (yr)
Events 32 47 31 13 Events 3 5 6 2
A No. at risk 628 326 157 57 B No. at risk 627 325 156 57
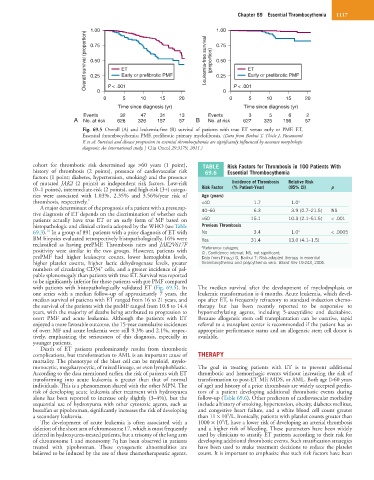
Fig. 69.5 Overall (A) and leukemia-free (B) survival of patients with true ET versus early or PMF. ET,
Essential thrombocythemia; PMF, prefibrotic primary myelofibrosis. (Data from Barbui T, Thiele J, Passamonti
F, et al: Survival and disease progression in essential thrombocythemia are significantly influenced by accurate morphologic
diagnosis: An international study. J Clin Oncol 29:3179, 2011.)
cohort for thrombotic risk determined age >60 years (1 point), TABLE Risk Factors for Thrombosis in 100 Patients With
history of thrombosis (2 points), presence of cardiovascular risk 69.6 Essential Thrombocythemia
factors (1 point; diabetes, hypertension, smoking) and the presence
of mutated JAK2 (2 points) as independent risk factors. Low-risk Incidence of Thrombosis Relative Risk
(0–1 points), intermediate-risk (2 points), and high-risk (3+) catego- Risk Factor (% Patient-Year) (95% CI) p
ries were associated with 1.03%, 2.35% and 3.56%/year risk of Age (years)
thrombosis, respectively. 9 <40 1.7 1.0 a
A major determinant of the prognosis of a patient with a presump-
tive diagnosis of ET depends on the discrimination of whether such 40–60 6.3 3.9 (0.7–21.5) NS
patients actually have true ET or an early form of MF based on >60 15.1 10.3 (2.1–51.5) < .001
histopathologic and clinical criteria adopted by the WHO (see Table Previous Thrombosis
14
69.3). In a group of 891 patients with a prior diagnosis of ET with No 3.4 1.0 a < .0005
BM biopsies evaluated retrospectively histopathologically, 16% were Yes 31.4 13.0 (4.1–1.5)
reclassified as having prePMF. Thrombosis rates and JAK2V617F a
Reference category.
positivity were similar in the two groups. However, patients with CI, Confidence interval; NS, not significant.
prePMF had higher leukocyte counts, lower hemoglobin levels, Data from Finazzi G, Barbui T: Risk-adapted therapy in essential
higher platelet counts, higher lactic dehydrogenase levels, greater thrombocythemia and polycythemia vera. Blood Rev 19:243, 2005.
+
numbers of circulating CD34 cells, and a greater incidence of pal-
pable splenomegaly than patients with true ET. Survival was reported
to be significantly inferior for those patients with pre PMF compared
with patients with histopathologically validated ET (Fig. 69.5). In The median survival after the development of myelodysplasia or
one series with a median follow-up of approximately 7 years, the leukemic transformation is 4 months. Acute leukemia, which devel-
median survival of patients with ET ranged from 16 to 21 years, and ops after ET, is frequently refractory to standard induction chemo-
the survival of the patients with the preMF ranged from 10.8 to 14.4 therapy but has been recently reported to be responsive to
years, with the majority of deaths being attributed to progression to hypomethylating agents, including 5-azacytidine and decitabine.
overt PMF and acute leukemia. Although the patients with ET Because allogeneic stem cell transplantation can be curative, rapid
enjoyed a more favorable outcome, the 15-year cumulative incidences referral to a transplant center is recommended if the patient has an
of overt MF and acute leukemia were still 9.3% and 2.1%, respec- appropriate performance status and an allogeneic stem cell donor is
tively, emphasizing the seriousness of this diagnosis, especially in available.
younger patients.
Death of ET patients predominantly results from thrombotic
complications, but transformation to AML is an important cause of THERAPY
mortality. The phenotype of the blast cell can be myeloid, myelo-
monocytic, megakaryocytic, of mixed lineage, or even lymphoblastic. The goal in treating patients with ET is to prevent additional
According to the data mentioned earlier, the risk of patients with ET thrombotic and hemorrhagic events without increasing the risk of
transforming into acute leukemia is greater than that of normal transformation to post-ET MF, MDS, or AML. Both age (>60 years
individuals. This is a phenomenon shared with the other MPN. The of age) and history of a prior thrombosis are widely accepted predic-
risk of developing acute leukemia after treatment with hydroxyurea tors of a patient developing additional thrombotic events during
alone has been reported to increase only slightly (3–4%), but the follow-up (Table 69.6). Other predictors of cardiovascular morbidity
sequential use of hydroxyurea with other cytotoxic agents, such as include a history of smoking, hypertension, obesity, diabetes mellitus,
busulfan or pipobroman, significantly increases the risk of developing and congestive heart failure, and a white blood cell count greater
9
a secondary leukemia. than 11 × 10 /L. Ironically, patients with platelet counts greater than
9
The development of acute leukemia is often associated with a 1000 × 10 /L have a lower risk of developing an arterial thrombosis
deletion of the short arm of chromosome 17, which is most frequently and a higher risk of bleeding. These parameters have been widely
deleted in hydroxyurea-treated patients, but a trisomy of the long arm used by clinicians to stratify ET patients according to their risk for
of chromosome 1 and monosomy 7q has been observed in patients developing additional thrombotic events. Such stratification strategies
treated with pipobroman. These cytogenetic abnormalities are have been used to make treatment decisions to reduce the platelet
believed to be induced by the use of these chemotherapeutic agents. count. It is important to emphasize that such risk factors have been