
Page 1466 - Hematology_ Basic Principles and Practice ( PDFDrive )
P. 1466
Chapter 81 Mantle Cell Lymphoma 1303
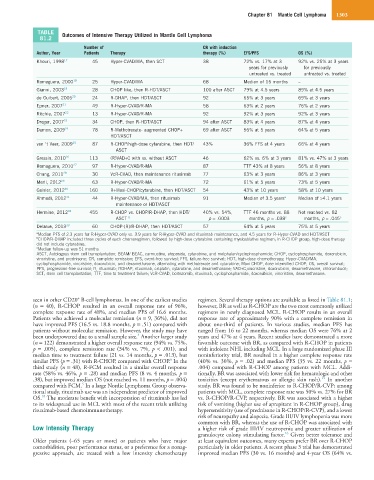
TABLE Outcomes of Intensive Therapy Utilized in Mantle Cell Lymphoma
81.2
Number of CR with induction
Author, Year Patients Therapy therapy (%) EFS/PFS OS (%)
Khouri, 1998 17 45 Hyper-CVAD/MA, then SCT 38 72% vs. 17% at 3 92% vs. 25% at 3 years
years for previously for previously
untreated vs. treated untreated vs. treated
Romaguera, 2000 18 25 Hyper-CVAD/MA 68 Median of 15 months –
Gianni, 2003 19 28 CHOP like, then R-HDT/ASCT 100 after ASCT 79% at 4.5 years 89% at 4.5 years
de Guibert, 2006 20 24 R-DHAP, then HDT/ASCT 92 65% at 3 years 69% at 3 years
Epner, 2007 21 49 R-Hyper-CVAD/R-MA 58 63% at 2 years 76% at 2 years
Ritchie, 2007 22 13 R-Hyper-CVAD/R-MA 92 92% at 3 years 92% at 3 years
Dreger, 2007 23 34 CHOP, then R-HDT/ASCT 94 after ASCT 83% at 4 years 87% at 4 years
Damon, 2009 24 78 R-Methotrexate- augmented CHOP+ 69 after ASCT 56% at 5 years 64% at 5 years
HDT/ASCT
van ‘t Veer, 2009 25 87 R-CHOP/high-dose cytarabine, then HDT/ 43% 36% FFS at 4 years 66% at 4 years
ASCT
Gressin, 2010 26 113 (R)VAD+C with vs. without ASCT 46 62% vs. 6% at 3 years 81% vs. 47% at 3 years
Romaguera, 2010 27 97 R-Hyper-CVAD/R-MA 87 TTF 43% at 8 years 56% at 8 years
Chang, 2011 28 30 VcR-CVAD, then maintenance rituximab 77 63% at 3 years 86% at 3 years
Merli, 2012 29 63 R-Hyper-CVAD/R-MA 72 61% at 5 years 73% at 5 years
Geisler, 2012 30 160 R+Maxi-CHOP/cytarabine, then HDT/ASCT 54 43% at 10 years 58% at 10 years
Ahmadi, 2012 31 44 R-Hyper-CVAD/MA, then rituximab 91 Median of 3.5 years a Median of >4.1 years
maintenance or HDT/ASCT
Hermine, 2012 32 455 R-CHOP vs. CHOP/R-DHAP, then HDT/ 40% vs. 54%, TTF 46 months vs. 88 Not reached vs. 82
ASCT b p = .0003 months, p = .038 c months, p = .045 c
Delarue, 2013 33 60 CHOP-(R)/R-DHAP, then HDT/ASCT 57 64% at 5 years 75% at 5 years
a Median PFS of 2.3 years for R-Hyper-CVAD only vs. 3.9 years for R-Hyper-CVAD and rituximab maintenance, and 4.5 years for R-Hyper-CVAD and HDT/ASCT
b CHOP/R-DHAP included three cycles of each chemoregimen, followed by high-dose cytarabine containing myeloablative regimen; in R-CHOP group, high-dose therapy
did not include cytarabine.
c Median follow-up was 51 months
ASCT, Autologous stem cell transplantation; BEAM/ BEAC, carmustine, etoposide, cytarabine, and melphalan/cyclophosphamide; CHOP, cyclophosphamide, doxorubicin,
vincristine, and prednisone; CR, complete remission; EFS, event-free survival; FFS, failure-free survival; HDT, high-dose chemotherapy; Hyper-CVAD/MA,
cyclophosphamide, vincristine, doxorubicin, and dexamethasone, alternating with methotrexate and cytarabine; Maxi-CHOP, dose-intensified CHOP; OS, overall survival;
PFS, progression-free survival; R, rituximab; RDHAP, rituximab, cisplatin, cytarabine, and dexamethasone; VAD+C,vincristine, doxorubicin, dexamethasone, chlorambucil;
SCT, stem cell transplantation; TTF, time to treatment failure; VcR-CVAD, bortezomib, rituximab, cyclophosphamide, doxorubicin, vincristine, dexamethasone.
+
seen in other CD20 B-cell lymphomas. In one of the earliest studies regimen. Several therapy options are available as listed in Table 81.1;
(n = 40), R-CHOP resulted in an overall response rate of 96%, however, BR as well as R-CHOP are the two most commonly utilized
complete response rate of 48%, and median PFS of 16.6 months. regimens in newly diagnosed MCL. R-CHOP results in an overall
Patients who achieved a molecular remission (n = 9, 36%), did not response rate of approximately 90% with a complete remission in
have improved PFS (16.5 vs. 18.8 months, p = .51) compared with about one-third of patients. In various studies, median PFS has
patients without molecular remission. However, the study may have ranged from 16 to 22 months, whereas median OS were 76% at 2
4
been underpowered due to a small sample size. Another larger study years and 47% at 4 years. Recent studies have demonstrated a more
(n = 122) demonstrated a higher overall response rate (94% vs. 75%, favorable outcome with BR, as compared with R-CHOP in patients
p = .005), complete remission rate (34% vs. 7%, p < .001), and with indolent NHL including MCL. In a large randomized phase III
median time to treatment failure (21 vs. 14 months, p = .013), but noninferiority trial, BR resulted in a higher complete response rate
6
similar PFS (p = .31) with R-CHOP, compared with CHOP. In the (40% vs. 30%, p = .02) and median PFS (35 vs. 22 months, p =
third study (n = 48), R-FCM resulted in a similar overall response .004) compared with R-CHOP among patients with MCL. Addi-
rate (58% vs. 46%, p = .28) and median PFS (8 vs. 4 months, p = tionally, BR was associated with lower risk for hematologic and other
14
.38), but improved median OS (not reached vs. 11 months, p = .004) toxicities (except erythematous or allergic skin rash). In another
5
compared with FCM. In a large Nordic Lymphoma Group observa- study, BR was found to be noninferior to R-CHOP/R-CVP; among
tional study, rituximab use was an independent predictor of improved patients with MCL, complete response rate was 50% vs. 27% for BR
35
OS. The moderate benefit with incorporation of rituximab has led vs. R-CHOP/R-CVP, respectively. BR was associated with a higher
to its widespread use in MCL with most of the recent trials utilizing risk of vomiting (higher use of aprepitant in R-CHOP group), drug
rituximab-based chemoimmunotherapy. hypersensitivity (use of prednisone in R-CHOP/R-CVP), and a lower
risk of neuropathy and alopecia. Grade III/IV lymphopenia was more
common with BR, whereas the use of R-CHOP was associated with
Low Intensity Therapy a higher risk of grade III/IV neutropenia and greater utilization of
16
granulocyte colony stimulating factor. Given better tolerance and
Older patients (~65 years or more) or patients who have major at least equivalent outcomes, many experts prefer BR over R-CHOP
comorbidities, poor performance status, or a preference for a nonag- particularly in older patients. A recent phase 3 trial has demonstrated
gressive approach, are treated with a low intensity chemotherapy improved median PFS (30 vs. 16 months) and 4-year OS (64% vs.