
Page 1566 - Hematology_ Basic Principles and Practice ( PDFDrive )
P. 1566
Chapter 86 Plasma Cell Neoplasms 1393
TABLE Evaluation of Patients With Multiple Myeloma be repeated to confirm achievement of a complete response. Patients
86.5 who produce intact immunoglobulins can also produce excess light
chain, giving a picture that is associated with both heavy and light
Evaluation for Diagnosis chains; for example, a patient can have an IgG κ and a κ light-chain
Evaluation for Monoclonal Protein myeloma. Associated with the presence of a monoclonal protein, the
Serum protein electrophoresis, immunofixation uninvolved immunoglobulins are suppressed. For example, patients
Quantitative immunoglobulin by nephelometric method with IgG myeloma will have suppressed IgA and IgM. In a setting
24-Hour urine collection for electrophoresis and Bence Jones where all three immunoglobulins are suppressed, one should suspect
protein assessment and immunofixation either light-chain disease and/or the possibility of IgD or IgE MM.
Serum free light chain and ratio Very rarely, a biclonal or triclonal pattern of immunoglobulins is
Evaluation for Clonal Plasma Cells observed, more often with the same light chain but rarely with a
Bone marrow aspirate and biopsy for different heterotypic light chain. This may suggest truly separate
Histology clones, especially with separate light chains. Quantitation of Bence
Clonality by immunostaining or flow cytometry by κ/λ staining Jones proteins in urine is still important, both for diagnosis of
Fine-needle aspiration of plasmacytoma if indicated myeloma and for follow-up. It is important to note that a free
Evaluation for End-Organ Damage light-chain measurement in the urine is not informative. Those
Hemogram to detect anemia patients with only a monoclonal protein in the urine require frequent
Chemistry panel for renal function and calcium 24-hour Bence Jones protein measurements during follow-up. Thera-
Radiologic evaluation: skeletal survey peutically, patients with each of the various types of immunoglobulins
PET-CT or MRI as indicated for bone lesions or extramedullary are treated with a similar type of therapy; however, patients with IgA
disease myeloma appear to have an inferior survival. The immunoglobulin
Evaluation for Risk Stratification isotype remains constant in a given patient over the natural history
of the disease; however, occasionally, a patient producing one immu-
β 2 -Microglobulin and serum albumin for ISS stage noglobulin at the time of diagnosis, at relapse, or with advanced
Cytogenetics and fluorescence in situ hybridization on bone marrow disease may present with only the same light chain as initially observed
sample
LDH with the original immunoglobulin (light chain escape) or occasionally
may become nonsecretory. Both the changes are reflective of the
C-reactive protein change in plasma cells to a more aggressive or undifferentiated form.
Other Investigations for Selected Patients As a result of the observed light-chain escape, patients without initial
Abdominal fat pad or rectal biopsy for amyloid Bence Jones proteins initially detected in the urine will require
Solitary lytic lesion biopsy periodic 24-hour urine Bence Jones protein measurements during
Serum viscosity if IgM component or high IgA levels or serum M follow-up.
component >7 g/dL The unique sequences that are observed with the idiotype protein
Immunofixation for IgD or IgE in select cases (CDR3) have been used as a marker that specifically identifies a
CT, Computed tomography; Ig, immunoglobulin; ISS, International Staging tumor cell clone and have been applied to a polymerase chain
System; LDH, lactate dehydrogenase; MRI, magnetic resonance imaging; PET, reaction–based methodology to detect MRD with high sensitivity.
positron emission tomography.
Early studies using such molecular methods for detecting MRD have
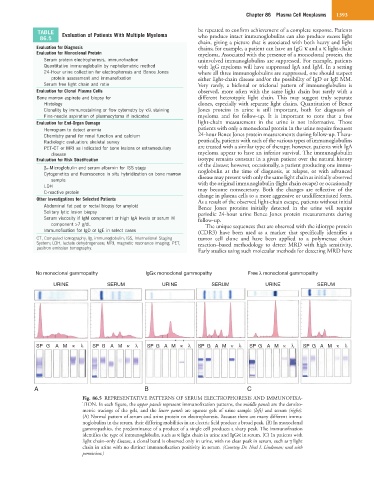
No monoclonal gammopathy lgGκ monoclonal gammopathy Free λ monoclonal gammopathy
URINE SERUM URINE SERUM URINE SERUM
SP G A M κ λ SP G A M κ λ SP G A M κ λ SP G A M κ λ SP G A M κ λ SP G A M κ λ
A B C
Fig. 86.5 REPRESENTATIVE PATTERNS OF SERUM ELECTROPHORESIS AND IMMUNOFIXA-
TION. In each figure, the upper panels represent immunofixation patterns, the middle panels are the densito-
metric tracings of the gels, and the lower panels are agarose gels of urine sample (left) and serum (right).
(A) Normal pattern of serum and urine protein on electrophoresis. Because there are many different immu-
noglobulins in the serum, their differing mobilities in an electric field produce a broad peak. (B) In monoclonal
gammopathies, the predominance of a product of a single cell produces a sharp peak. The immunofixation
identifies the type of immunoglobulin, such as κ light chain in urine and IgGκ in serum. (C) In patients with
light chain–only disease, a clonal band is observed only in urine, with no clear peak in serum, such as γ light
chain in urine with no distinct immunofixation positivity in serum. (Courtesy Dr. Neal I. Lindeman; used with
permission.)