
Page 2634 - Hematology_ Basic Principles and Practice ( PDFDrive )
P. 2634
Chapter 162 Resources for the Hematologist e15
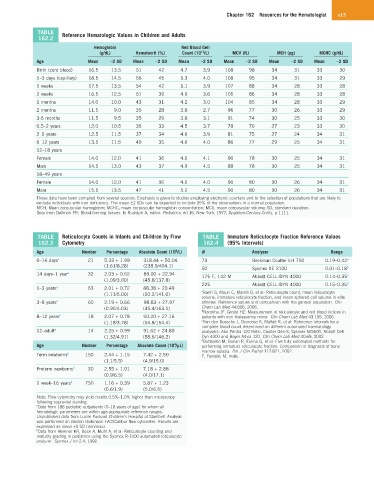
TABLE Reference Hematologic Values in Children and Adults
162.2
Hemoglobin Red Blood Cell
12
(g/dL) Hematocrit (%) Count (10 /L) MCV (fL) MCH (pg) MCHC (g/dL)
Age Mean −2 SD Mean −2 SD Mean −2 SD Mean −2 SD Mean −2 SD Mean −2 SD
Birth (cord blood) 16.5 13.5 51 42 4.7 3.9 108 98 34 31 33 30
1–3 days (capillary) 18.5 14.5 56 45 5.3 4.0 108 95 34 31 33 29
1 weeks 17.5 13.5 54 42 5.1 3.9 107 88 34 28 33 28
2 weeks 16.5 12.5 51 39 4.9 3.6 105 86 34 28 33 28
1 months 14.0 10.0 43 31 4.2 3.0 104 85 34 28 33 29
2 months 11.5 9.0 35 28 3.8 2.7 96 77 30 26 33 29
3-6 months 11.5 9.5 35 29 3.8 3.1 91 74 30 25 33 30
0.5–2 years 12.0 10.5 36 33 4.5 3.7 78 70 27 23 33 30
2–6 years 12.5 11.5 37 34 4.6 3.9 81 75 27 24 34 31
6–12 years 13.5 11.5 40 35 4.6 4.0 86 77 29 25 34 31
12–18 years
Female 14.0 12.0 41 36 4.6 4.1 90 78 30 25 34 31
Male 14.5 13.0 43 37 4.9 4.5 88 78 30 25 34 31
18–49 years
Female 14.0 12.0 41 36 4.6 4.0 90 80 30 26 34 31
Male 15.5 13.5 47 41 5.2 4.5 90 80 30 26 34 31
These data have been compiled from several sources. Emphasis is given to studies employing electronic counters and to the selection of populations that are likely to
exclude individuals with iron deficiency. The mean ±2 SDs can be expected to include 95% of the observations in a normal population.
MCH, Mean corpuscular hemoglobin; MCHC, mean corpuscular hemoglobin concentration; MCV, mean corpuscular volume; SD, standard deviation.
Data from Dallman PR: Blood-forming tissues. In Rudolph A, editor: Pediatrics, ed 16, New York, 1977, Appleton-Century-Crofts, p 1111.
TABLE Reticulocyte Counts in Infants and Children by Flow TABLE Immature Reticulocyte Fraction Reference Values
162.3 Cytometry 162.4 (95% Intervals)
Age Number Percentage Absolute Count (10 /L) N Analyzer Range
9
0–14 days a 21 5.33 + 1.99 318.44 + 50.04 73 Beckman Coulter LH 750 0.19–0.42 a
(1.61/8.28) (238.9/404.1) b
50 Sysmex XE 2100 0.01–0.18
14 days–1 year a 32 2.03 + 0.52 89.00 + 22.94 175 F, 142 M Abbott CELL-DYN 4000 0.14–0.35 c
(1.09/3.00) (45.8/137.8)
225 Abbott CELL-DYN 4000 0.15–0.35 d
1–3 years a 63 2.01 + 0.72 88.38 + 20.49 a
(1.11/5.00) (50.2/141.0) Banfi G, Mauri C, Morelli B, et al: Reticulocyte count, mean reticulocyte
volume, immature reticulocyte fraction, and mean sphered cell volume in elite
3–8 years a 60 2.19 + 0.66 98.83 + 27.97 athletes: Reference values and comparison with the general population. Clin
(0.95/4.03) (45.4/163.1) Chem Lab Med 44:616, 2006.
b
Noronha JF, Grotto HZ: Measurement of reticulocyte and red blood indices in
8–12 years a 18 2.07 + 0.78 90.20 + 27.16 patients with iron thalassemia minor. Clin Chem Lab Med 43:195, 2005.
(1.18/3.78) (54.8/154.4) c Van den Bossche J, Devreese K, Malfait R, et al: Reference intervals for a
complete blood count determined on different automated haematology
12–adult a 14 2.25 + 0.99 91.62 + 24.80 analysers: Abx Pentra 120 Retic, Coulter Gen-S, Sysmex SE9500, Abbott Cell
(1.32/4.91) (58.6/146.2) Dyn 4000 and Bayer Advia 120. Clin Chem Lab Med 40:69, 2002.
d Buttarello M, Bulian P, Farina G, et al: Five fully automated methods for
Age Number Percentage Absolute Count (10 /µL) performing immature reticulocyte fraction: Comparison in diagnosis of bone
4
marrow aplasia. Am J Clin Pathol 117:871, 2002.
Term newborns b 150 2.44 + 1.15 7.42 + 2.50 F, Female; M, male.
(1.1/5.5) (4.9/15.0)
Preterm newborns b 30 2.55 + 1.01 7.18 + 2.88
(0.9/6.5) (4.0/17.1)
1 week–16 years b 750 1.16 + 0.39 5.87 + 1.23
(0.6/1.9) (5.0/6.5)
Note: Flow cytometry may yield results 0.5%–1.0% higher than microscopy
following supravital staining.
a Data from 188 pediatric outpatients (0–18 years of age) for whom all
hematologic parameters are within age-appropriate reference ranges.
Unpublished data from Lucile Packard Children’s Hospital at Stanford. Analysis
was performed on Becton Dickinson FACSCalibur flow cytometer. Results are
expressed as mean +1 SD (min/max).
b Data from Herkner KR, Bock A, Muhl A, et al: Reticulocyte counting and
maturity grading in pediatrics using the Sysmex R-1000 automated reticulocyte
analyzer. Sysmex J Int 2:4, 1992.