
Page 2637 - Hematology_ Basic Principles and Practice ( PDFDrive )
P. 2637
e18 Part XIII Consultative Hematology
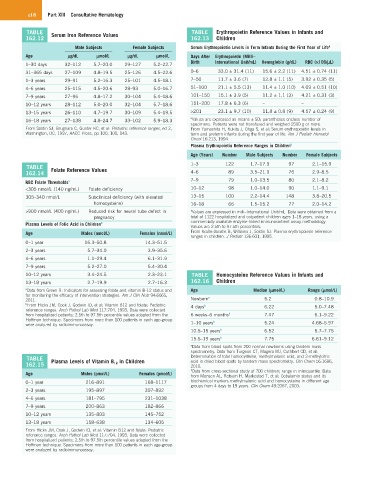
TABLE TABLE Erythropoietin Reference Values in Infants and
162.12 Serum Iron Reference Values 162.13 Children
Male Subjects Female Subjects Serum Erythropoietin Levels in Term Infants During the First Year of Life a
Age µg/dL µmol/L µg/dL µmol/L Days After Erythropoietin (Milli–
Birth International Unit/mL) Hemoglobin (g/dL) RBC (×106/µL)
1–30 days 32–112 5.7–20.0 29–127 5.2–22.7
31–365 days 27–109 4.8–19.5 25–126 4.5–22.6 0–6 33.0 ± 31.4 (11) 15.6 ± 2.2 (11) 4.51 ± 0.74 (11)
1–3 years 29–91 5.2–16.3 25–101 4.5–18.1 7–50 11.7 ± 3.6 (7) 12.8 ± 1.1 (5) 3.92 ± 0.35 (5)
4–6 years 25–115 4.5–20.6 28–93 5.0–16.7 51–100 21.1 ± 5.5 (13) 11.4 ± 1.0 (10) 4.09 ± 0.51 (10)
7–9 years 27–96 4.8–17.2 30–104 5.4–18.6 101–150 15.1 ± 3.9 (5) 11.2 ± 1.1 (3) 4.21 ± 0.31 (3)
10–12 years 28–112 5.0–20.0 32–104 5.7–18.6 151–200 17.8 ± 6.3 (6) – –
13–15 years 26–110 4.7–19.7 30–109 5.4–19.5 >201 23.1 ± 9.7 (10) 11.8 ± 0.8 (9) 4.57 ± 0.24 (9)
16–18 years 27–138 4.8–24.7 33–102 5.9–18.3 a Values are expressed as means ± SD; parentheses enclose number of
specimens. Patients were not transfused and weighed 2500 g or more.
From Soldin SJ, Brugnara C, Gunter KC, et al: Pediatric reference ranges, ed 2, From Yamashita H, Kukita J, Ohga S, et al: Serum erythropoietin levels in
Washington, DC, 1997, AACC Press, pp 100, 101, 143. term and preterm infants during the first year of life. Am J Pediatr Hematol
Oncol 16:213, 1994.
Plasma Erythropoietin Reference Ranges in Children b
Age (Years) Number Male Subjects Number Female Subjects
1–3 122 1.7–17.9 97 2.1–15.9
TABLE
162.14 Folate Reference Values 4–6 89 3.5–21.9 76 2.9–8.5
7–9 79 1.0–13.5 80 2.1–8.2
RBC Folate Thresholds a
<305 nmol/L (140 ng/mL) Folate deficiency 10–12 98 1.0–14.0 90 1.1–9.1
305–340 nmol/L Subclinical deficiency (with elevated 13–15 100 2.2–14.4 148 3.8–20.5
homocysteine) 16–18 66 1.5–15.2 77 2.0–14.2
>900 nmol/L (400 ng/mL) Reduced risk for neural tube defect in b Values are expressed in milli–International Unit/mL. Data were obtained from a
pregnancy total of 1122 hospitalized and outpatient children ages 1–18 years, using a
Plasma Levels of Folic Acid in Children b commercially available enzyme-linked immunosorbent assay methodology.
Values are 2.5th to 97.5th percentiles.
Age Males (nmol/L) Females (nmol/L) From Krafte-Jacobs B, Williams J, Soldin SJ: Plasma erythropoietin reference
ranges in children. J Pediatr 126:601, 1995.
0–1 year 16.3–50.8 14.3–51.5
2–3 years 5.7–34.0 3.9–35.6
4–6 years 1.1–29.4 6.1–31.9
7–9 years 5.2–27.0 5.4–30.4
10–12 years 3.4–24.5 2.3–23.1 TABLE Homocysteine Reference Values in Infants and
13–18 years 2.7–19.9 2.7–16.3 162.16 Children
a Data from Green R: Indicators for assessing folate and vitamin B-12 status and Age Median (µmol/L) Range (µmol/L)
for monitoring the efficacy of intervention strategies. Am J Clin Nutr 94:666S, a
2011. Newborn 5.2 0.8–10.9
b From Hicks JM, Cook J, Godwin ID, et al: Vitamin B12 and folate: Pediatric 4 days b 6.22 5.0–7.48
reference ranges. Arch Pathol Lab Med 117:704, 1993. Data were collected
from hospitalized patients; 2.5th to 97.5th percentile values adapted from the 6 weeks–6 months b 7.47 6.1–9.22
Hoffman technique. Specimens from more than 100 patients in each age-group b
were analyzed by radioimmunoassay. 1–10 years 5.24 4.68–5.97
10.5–15 years b 6.52 5.7–7.75
15.5–19 years b 7.75 6.61–9.12
a Data from blood spots from 200 normal newborns using tandem mass
spectrometry. Data from Turgeon CT, Magera MJ, Cuthbert CD, et al:
TABLE Determination of total homocysteine, methylmalonic acid, and 2-methylcitric
162.15 Plasma Levels of Vitamin B 12 in Children acid in dried blood spots by tandem mass spectrometry. Clin Chem 56:1686,
2010.
b Data from cross-sectional study of 700 children; range in interquartile. Data
Age Males (pmol/L) Females (pmol/L)
from Monsen AL, Refsum H, Markestad T, et al: Cobalamin status and its
0–1 year 216–891 168–1117 biochemical markers methylmalonic acid and homocysteine in different age
groups from 4 days to 19 years. Clin Chem 49:2067, 2003.
2–3 years 195–897 307–892
4–6 years 181–795 231–1038
7–9 years 200–863 182–866
10–12 years 135–803 145–752
13–18 years 158–638 134–605
From Hicks JM, Cook J, Godwin ID, et al: Vitamin B12 and folate: Pediatric
reference ranges. Arch Pathol Lab Med 117:704, 1993. Data were collected
from hospitalized patients; 2.5th to 97.5th percentile values adapted from the
Hoffman technique. Specimens from more than 100 patients in each age-group
were analyzed by radioimmunoassay.