
Page 2638 - Hematology_ Basic Principles and Practice ( PDFDrive )
P. 2638
Chapter 162 Resources for the Hematologist e19
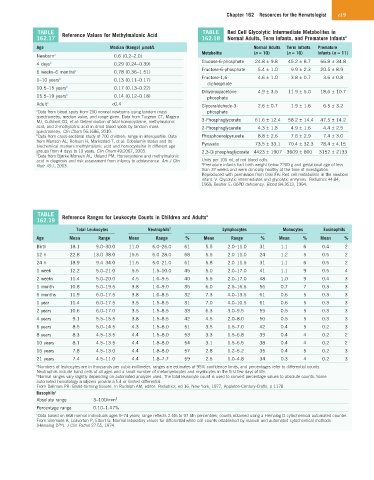
TABLE TABLE Red Cell Glycolytic Intermediate Metabolites in
162.17 Reference Values for Methylmalonic Acid 162.18 Normal Adults, Term Infants, and Premature Infants a
Age Median (Range) µmol/L Normal Adults Term Infants Premature
Metabolite (n = 10) (n = 10) Infants (n = 11)
Newborn a 0.6 (0.2–2.0)
Glucose-6-phosphate 24.8 ± 9.8 45.2 ± 8.7 66.8 ± 34.8
4 days b 0.29 (0.24–0.39)
Fructose-6-phosphate 5.4 ± 1.0 9.9 ± 2.3 20.5 ± 8.9
6 weeks–6 months b 0.78 (0.36–1.51)
Fructose-1,6- 4.6 ± 1.0 3.8 ± 0.7 3.6 ± 0.8
1–10 years b 0.13 (0.11–0.17)
diphosphate
10.5–15 years b 0.17 (0.13–0.22)
Dihydroxyacetone 4.9 ± 3.5 11.9 ± 5.0 18.6 ± 10.7
15.5–19 years b 0.14 (0.12–0.18) phosphate
Adult c <0.4 Glyceraldehyde-3- 2.6 ± 0.7 1.9 ± 1.6 6.5 ± 3.2
a Data from blood spots from 200 normal newborns using tandem mass phosphate
spectrometry, median value, and range given. Data from Turgeon CT, Magera
MJ, Cuthbert CD, et al: Determination of total homocysteine, methylmalonic 3-Phosphoglycerate 61.6 ± 12.4 58.2 ± 14.4 47.5 ± 14.2
acid, and 2-methylcitric acid in dried blood spots by tandem mass 2-Phosphoglycerate 4.3 ± 1.8 4.9 ± 1.6 4.4 ± 2.5
spectrometry. Clin Chem 56:1686, 2010.
b Data from cross-sectional study of 700 children; range in interquartile. Data Phosphoenolpyruvate 8.8 ± 2.6 7.6 ± 2.9 7.4 ± 3.0
from Monsen AL, Refsum H, Markestad T, et al: Cobalamin status and its Pyruvate 73.5 ± 33.1 70.4 ± 32.3 78.4 ± 4.15
biochemical markers methylmalonic acid and homocysteine in different age
groups from 4 days to 19 years. Clin Chem 49:2067, 2003. 2,3-Diphosphoglycerate 4423 ± 1907 3609 ± 800 3152 ± 2133
c Data from Bjørke Monsen AL, Ueland PM: Homocysteine and methylmalonic
acid in diagnosis and risk assessment from infancy to adolescence. Am J Clin Units per 100 mL of red blood cells.
a
Nutr 78:7, 2003. Premature infants had birth weight below 2200 g and gestational age of less
than 37 weeks and were clinically healthy at the time of investigation.
Reproduced with permission from Oski FA: Red cell metabolism in the newborn
infant. V. Glycolytic intermediates and glycolytic enzymes. Pediatrics 44:84,
1969; Beutler E: G6PD deficiency. Blood 84:3613, 1994.
TABLE a
162.19 Reference Ranges for Leukocyte Counts in Children and Adults
Total Leukocytes Neutrophils b Lymphocytes Monocytes Eosinophils
Age Mean Range Mean Range % Mean Range % Mean % Mean %
Birth 18.1 9.0–30.0 11.0 6.0–26.0 61 5.5 2.0–11.0 31 1.1 6 0.4 2
12 h 22.8 13.0–38.0 15.5 6.0–28.0 68 5.5 2.0–11.0 24 1.2 5 0.5 2
24 h 18.9 9.4–34.0 11.5 5.0–21.0 61 5.8 2.0–11.5 31 1.1 6 0.5 2
1 week 12.2 5.0–21.0 5.5 1.5–10.0 45 5.0 2.0–17.0 41 1.1 9 0.5 4
2 weeks 11.4 5.0–20.0 4.5 1.0–9.5 40 5.5 2.0–17.0 48 1.0 9 0.4 3
1 month 10.8 5.0–19.5 3.8 1.0–9.0 35 6.0 2.5–16.5 56 0.7 7 0.3 3
6 months 11.9 6.0–17.5 3.8 1.0–8.5 32 7.3 4.0–13.5 61 0.6 5 0.3 3
1 year 11.4 6.0–17.5 3.5 1.5–8.5 31 7.0 4.0–10.5 61 0.6 5 0.3 3
2 years 10.6 6.0–17.0 3.5 1.5–8.5 33 6.3 3.0–9.5 59 0.5 5 0.3 3
4 years 9.1 5.5–15.5 3.8 1.5–8.5 42 4.5 2.0–8.0 50 0.5 5 0.3 3
6 years 8.5 5.0–14.5 4.3 1.5–8.0 51 3.5 1.5–7.0 42 0.4 5 0.2 3
8 years 8.3 4.5–13.5 4.4 1.5–8.0 53 3.3 1.5–6.8 39 0.4 4 0.2 2
10 years 8.1 4.5–13.5 4.4 1.8–8.0 54 3.1 1.5–6.5 38 0.4 4 0.2 2
16 years 7.8 4.5–13.0 4.4 1.8–8.0 57 2.8 1.2–5.2 35 0.4 5 0.2 3
21 years 7.4 4.5–11.0 4.4 1.8–7.7 59 2.5 1.0–4.8 34 0.3 4 0.2 3
a Numbers of leukocytes are in thousands per cubic millimeter, ranges are estimates of 95% confidence limits, and percentages refer to differential counts.
Neutrophils include band cells at all ages and a small number of metamyelocytes and myelocytes in the first few days of life.
b Normal ranges vary slightly depending on automated analyzer used. The total leukocyte count is used to convert percentage values to absolute counts. Some
automated hematology analyzers provide a full or limited differential.
From Dallman PR: Blood-forming tissues. In Rudolph AM, editor: Pediatrics, ed 16, New York, 1977, Appleton-Century-Crofts, p 1178.
Basophils c
Absolute range 3–100/mm 3
Percentage range 0.10–1.47%
c Data based on 668 normal individuals ages 5–74 years; range reflects 2.5th to 97.5th percentiles; counts obtained using a Hemalog D cytochemical automated counter.
From Simmons A, Leaverton P, Elbert G: Normal laboratory values for differential white cell counts established by manual and automated cytochemical methods
(Hemalog D™). J Clin Pathol 27:55, 1974.