
Page 2635 - Hematology_ Basic Principles and Practice ( PDFDrive )
P. 2635
e16 Part XIII Consultative Hematology
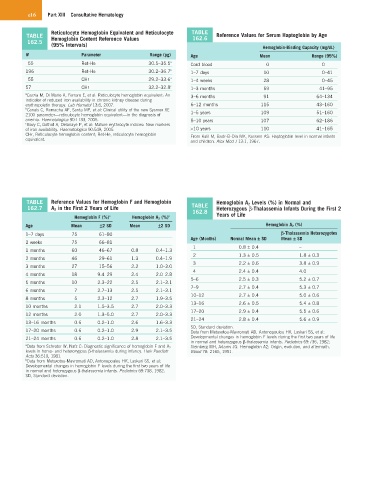
Reticulocyte Hemoglobin Equivalent and Reticulocyte TABLE
TABLE Hemoglobin Content Reference Values 162.6 Reference Values for Serum Haptoglobin by Age
162.5 (95% Intervals)
Hemoglobin-Binding Capacity (mg/dL)
N Parameter Range (pg) Age Mean Range (95%)
55 Ret-He 30.5–35.5 a Cord blood 0 0
196 Ret-He 30.2–36.7 b 1–7 days 10 0–41
55 CHr 29.2–33.6 a 1–4 weeks 28 0–45
57 CHr 32.2–32.8 c 1–3 months 59 41–95
a Garzia M, Di Mario A, Ferraro E, et al: Reticulocyte hemoglobin equivalent: An 3–6 months 91 64–134
indicator of reduced iron availability in chronic kidney disease during
erythropoietin therapy. Lab Hematol 13:6, 2007. 6–12 months 115 43–160
b Canals C, Remacha AF, Sarda MP, et al: Clinical utility of the new Sysmex XE
2100 parameter—reticulocyte hemoglobin equivalent—in the diagnosis of 1–5 years 109 51–160
anemia. Haematologica 90:1133, 2005. 5–10 years 107 62–186
c Bovy C, Gothot A, Delanaye P, et al: Mature erythrocyte indices: New markers
of iron availability. Haematologica 90:549, 2005. >10 years 110 41–165
CHr, Reticulocyte hemoglobin content; Ret-He, reticulocyte hemoglobin From Kalil M, Badr-El-Din MK, Kassem AS: Haptoglobin level in normal infants
equivalent. and children. Alex Med J 13:1, 1967.
TABLE Reference Values for Hemoglobin F and Hemoglobin Hemoglobin A 2 Levels (%) in Normal and
162.7 A 2 in the First 2 Years of Life TABLE Heterozygous β-Thalassemia Infants During the First 2
162.8
Hemoglobin F (%) a Hemoglobin A 2 (%) b Years of Life
Age Mean ±2 SD Mean ±2 SD Hemoglobin A 2 (%)
1–7 days 75 61–80 β-Thalassemia Heterozygotes
Age (Months) Normal Mean ± SD Mean ± SD
2 weeks 75 66–81
1 0.8 ± 0.4 –
1 months 60 46–67 0.8 0.4–1.3
2 1.3 ± 0.5 1.8 ± 0.3
2 months 46 29–61 1.3 0.4–1.9
3 2.2 ± 0.6 3.8 ± 0.9
3 months 27 15–56 2.2 1.0–3.0
4 2.4 ± 0.4 4.0
4 months 18 9.4–29 2.4 2.0–2.8
5–6 2.5 ± 0.3 5.2 ± 0.7
5 months 10 2.3–22 2.5 2.1–3.1
7–9 2.7 ± 0.4 5.3 ± 0.7
6 months 7 2.7–13 2.5 2.1–3.1
10–12 2.7 ± 0.4 5.0 ± 0.6
8 months 5 2.3–12 2.7 1.9–3.5
13–16 2.6 ± 0.5 5.4 ± 0.8
10 months 2.1 1.5–3.5 2.7 2.0–3.3
17–20 2.9 ± 0.4 5.5 ± 0.6
12 months 2.0 1.3–5.0 2.7 2.0–3.3
21–24 2.8 ± 0.4 5.6 ± 0.9
13–16 months 0.6 0.2–1.0 2.6 1.6–3.3
SD, Standard deviation.
17–20 months 0.6 0.2–1.0 2.9 2.1–3.5 Data from Metaxotou-Mavromati AD, Antonopoulou HK, Laskari SS, et al:
21–24 months 0.6 0.2–1.0 2.8 2.1–3.5 Developmental changes in hemoglobin F levels during the first two years of life
in normal and heterozygous β-thalassemia infants. Pediatrics 69:736, 1982;
a Data from Schroter W, Nafz C: Diagnostic significance of hemoglobin F and A 2 Steinberg MH, Adams JG: Hemoglobin A2: Origin, evolution, and aftermath.
levels in homo- and heterozygous β-thalassemia during infancy. Helv Paediatr Blood 78: 2165, 1991.
Acta 36:519, 1981.
b Data from Metaxotou-Mavromati AD, Antonopoulou HK, Laskari SS, et al:
Developmental changes in hemoglobin F levels during the first two years of life
in normal and heterozygous β-thalassemia infants. Pediatrics 69:738, 1982.
SD, Standard deviation.