
Page 2636 - Hematology_ Basic Principles and Practice ( PDFDrive )
P. 2636
Chapter 162 Resources for the Hematologist e17
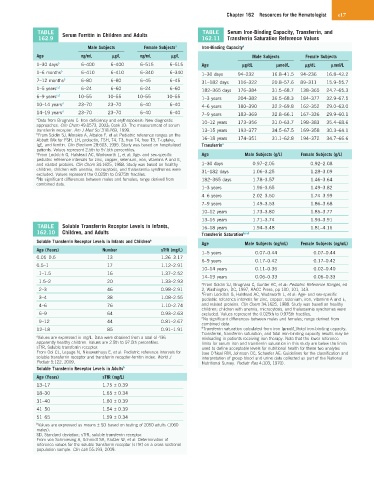
TABLE Serum Ferritin in Children and Adults TABLE Serum Iron-Binding Capacity, Transferrin, and
162.9 162.11 Transferrin Saturation Reference Values
Male Subjects Female Subjects a Iron-Binding Capacity a
Age ng/mL µg/L ng/mL µg/L Male Subjects Female Subjects
1–30 days b 6–400 6–400 6–515 6–515 Age µg/dL µmol/L µg/dL µmol/L
1–6 months b 6–410 6–410 6–340 6–340 1–30 days 94–232 16.8–41.5 94–236 16.8–42.2
7–12 months b 6–80 6–80 6–45 6–45 31–182 days 116–322 20.8–57.6 89–311 15.9–55.7
1–5 years c,d 6–24 6–60 6–24 6–60 182–365 days 176–384 31.5–68.7 138–365 24.7–65.3
6–9 years c,d 10–55 10–55 10–55 10–55 1–3 years 204–382 36.5–68.3 184–377 32.9–67.5
10–14 years d 23–70 23–70 6–40 6–40 4–6 years 180–390 32.2–69.8 162–352 29.0–63.0
14–19 years d 23–70 23–70 6–40 6–40 7–9 years 183–369 32.8–66.1 167–336 29.9–60.1
a Data from Brugnara C: Iron deficiency and erythropoiesis: New diagnostic 10–12 years 173–356 31.0–63.7 198–383 35.4–68.6
approaches. Clin Chem 49:1573, 2003; Cook JD: The measurement of serum
transferrin receptor. Am J Med Sci 318:269, 1999. 13–15 years 193–377 34.5–67.5 169–358 30.3–64.1
b From Soldin SJ, Morales A, Albalos F, et al: Pediatric reference ranges on the
Abbott IMx for FSH, LH, prolactin, TSH, T4, T3, free T4, free T3, T-uptake, 16–18 years 174–351 31.1–62.8 194–372 34.7–66.6
IgE, and ferritin. Clin Biochem 28:603, 1995. Study was based on hospitalized Transferrin a
patients. Values represent 2.5th to 97.5th percentiles.
c From Lockitch G, Halstead AC, Wadsworth L, et al: Age- and sex-specific Age Male Subjects (g/L) Female Subjects (g/L)
pediatric reference intervals for zinc, copper, selenium, iron, vitamins A and E,
and related proteins. Clin Chem 34:1625, 1988. Study was based on healthy 1–30 days 0.97–2.05 0.92–2.08
children; children with anemia, microcytosis, and thalassemia syndromes were 31–182 days 1.06–3.25 1.28–3.09
excluded. Values represent the 0.025th to 0.975th fractiles.
d No significant differences between males and females; range derived from 182–365 days 1.78–3.57 1.46–3.64
combined data.
1–3 years 1.96–3.65 1.49–3.82
4–6 years 2.02–3.50 1.74–3.99
7–9 years 1.49–3.53 1.86–3.68
10–12 years 1.73–3.80 1.85–3.77
13–15 years 1.71–3.74 1.93–3.91
TABLE Soluble Transferrin Receptor Levels in Infants, 16–18 years 1.94–3.48 1.81–4.16
162.10 Children, and Adults Transferrin Saturation b,c,d
Soluble Transferrin Receptor Levels in Infants and Children a Age Male Subjects (ng/mL) Female Subjects (ng/mL)
Age (Years) Number sTfR (mg/L)
1–5 years 0.07–0.44 0.07–0.44
0.05–0.5 13 1.26–3.17
6–9 years 0.17–0.42 0.17–0.42
0.5–1 17 1.12–2.91
10–14 years 0.11–0.36 0.02–0.40
1–1.5 16 1.37–2.52
14–19 years 0.06–0.33 0.06–0.33
1.5–2 20 1.33–2.93 a From Soldin SJ, Brugnara C, Gunter KC, et al: Pediatric Reference Ranges, ed
2–3 46 0.98–2.91 2, Washington, DC, 1997, AACC Press, pp 100, 101, 143.
b From Lockitch G, Halstead AC, Wadsworth L, et al: Age- and sex-specific
3–4 38 1.08–2.55 pediatric reference intervals for zinc, copper, selenium, iron, vitamins A and E,
4–6 76 1.10–2.74 and related proteins. Clin Chem 34:1625, 1988. Study was based on healthy
children; children with anemia, microcytosis, and thalassemia syndromes were
6–9 64 0.93–2.63 excluded. Values represent the 0.025th to 0.975th fractiles.
c No significant differences between males and females; range derived from
9–12 44 0.81–2.67
combined data.
12–18 85 0.91–1.91 d Transferrin saturation calculated from iron (µmol/L)/total iron-binding capacity.
Transferrin, transferrin saturation, and total iron-binding capacity results may be
a Values are expressed in mg/L. Data were obtained from a total of 436 misleading in patients receiving iron therapy. Note that the lower reference
apparently healthy children. Values are 2.5th to 97.5th percentiles. limits for serum iron and transferrin saturation in this study are below the limits
sTfR, Soluble transferrin receptor. used to define acceptable levels for nutritional health for these two analytes
From Ooi CL, Lepage N, Nieuwenhuys E, et al: Pediatric reference intervals for (see O’Neal RM, Johnson OC, Schaefer AE: Guidelines for the classification and
soluble transferrin receptor and transferrin receptor-ferritin index. World J interpretation of group blood and urine data collected as part of the National
Pediatr 5:122, 2009. Nutritional Survey. Pediatr Res 4:103, 1970).
Soluble Transferrin Receptor Levels in Adults b
Age (Years) sTfR (mg/L)
13–17 1.75 ± 0.39
18–30 1.65 ± 0.34
31–40 1.60 ± 0.39
41–50 1.54 ± 0.39
51–65 1.59 ± 0.34
b Values are expressed as means ± SD based on testing of 2050 adults (1060
males).
SD, Standard deviation; sTfR, soluble transferrin receptor.
From von Schmiesing A, Schmidt SA, Kratzer W, et al: Determination of
reference values for the soluble transferrin receptor (sTfR) on a cross sectional
population sample. Clin Lab 55:193, 2009.