
Page 128 - Williams Hematology ( PDFDrive )
P. 128
104 Part III: Epochal Hematology Chapter 7: Hematology of the Fetus and Newborn 105
flow, and relieved the symptoms. However, cerebral blood flow was nor- O 2 content in newborn and adult blood
mal in the asymptomatic infants with hyperviscosity, and, consequently, O O
2
2
104
there was no benefit from exchange transfusion. Studies of neurode- 20 Available Released
velopmental status do not show any clear long-term benefits for the use
of partial exchange transfusions in asymptomatic neonates. 105 Newborn
Adult
Red Cell Antigens The blood group antigens on neonatal red cells 16 Newborn
differ from those of the older child and adult. The i antigen is expressed Adult Adult blood p50 = 27 mm
strongly, whereas the I antigen and the A and B antigens are expressed 12
only weakly on neonatal red cells. The i antigen is a straight-chain car- Newborn blood p50 = 19 mm
bohydrate that is replaced by the branched-chain derivative, I antigen, Blood O 2 content (mL/dL)
106
as a result of the developmental acquisition of a glycosyltransferase. 8 O 2 Released (mL/dL)
By 1 year of age the i antigen is undetectable, and the ABH antigens Hemoglobin 13g/dL 15g/dL 17g/dL
increase to adult levels by age 3 years (Chap. 136). The ABH, Kell, Duffy, Adult 3.9 4.5
and Vel antigens can be detected on the cells of the fetus in the first 4 Newborn 2.6 3.0 3.4
b
a
trimester and are present at birth. The Lu and Lu antigens also are
107
detectable on fetal red cells and are more weakly expressed at birth, 0
increasing to adult levels by age 15 years. The Xg antigen is variably 0 20 40 60 80 100
107
expressed in the fetus and is weaker on newborn than on adult red cells. Oxygen tension Po (torr)
Moreover, particularly poor expression of Xg has been noted in new- 2
107
b
a
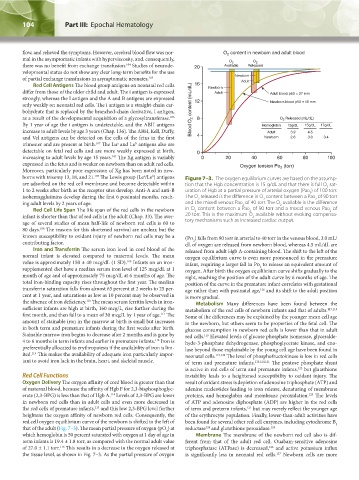
borns with trisomy 13, 18, and 21. The Lewis group (Le /Le ) antigens Figure 7–3. The oxygen equilibrium curves are based on the assump-
are adsorbed on the red cell membrane and become detectable within tion that the Hgb concentration is 15 g/dL and that there is full O sat-
2
1 to 2 weeks after birth as the receptor sites develop. Anti-A and anti-B uration of Hgb at a partial pressure of arterial oxygen (Pao ) of 100 torr.
2
isohemagglutinins develop during the first 6 postnatal months, reach- The O released is the difference in O content between a Pao of 90 torr
2
2
2
ing adult levels by 2 years of age. and the mixed venous Pao of 40 torr. The O available is the difference
2
2
Red Cell Life Span The life span of the red cells in the newborn in O content between a Pao of 90 torr and a mixed venous Pao of
2
2
2
infant is shorter than that of red cells in the adult (Chap. 33). The aver- 20 torr. This is the maximum O available without evoking compensa-
2
age of several studies of mean half-life of newborn red cells is 60 to tory mechanisms such as increased cardiac output.
80 days. The reasons for this shortened survival are unclear, but the
108
known susceptibility to oxidant injury of newborn red cells may be a (Po ) falls from 90 torr in arterial to 40 torr in the venous blood, 3.0 mL/
2
contributing factor. dL of oxygen are released from newborn blood, whereas 4.5 mL/dL are
Iron and Transferrin The serum iron level in cord blood of the released from adult Hgb A-containing blood. The shift to the left of the
normal infant is elevated compared to maternal levels. The mean oxygen equilibrium curve is even more pronounced in the premature
value is approximately 150 ± 40 mcg/dL (1 SD). Infants on an iron- infant, requiring a larger fall in Po to release an equivalent amount of
109
2
supplemented diet have a median serum iron level of 125 mcg/dL at 1 oxygen. After birth the oxygen equilibrium curve shifts gradually to the
month of age and of approximately 75 mcg/dL at 6 months of age. The right, reaching the position of the adult curve by 6 months of age. The
total iron-binding capacity rises throughout the first year. The median position of the curve in the premature infant correlates with gestational
transferrin saturation falls from almost 65 percent at 2 weeks to 25 per- age rather than with postnatal age, and its shift to the adult position
116
cent at 1 year, and saturations as low as 10 percent may be observed in is more gradual.
the absence of iron deficiency. The mean serum ferritin levels in iron- Metabolism Many differences have been found between the
110
sufficient infants are high at birth, 160 mcg/L, rise further during the metabolism of the red cells of newborn infants and that of adults. 117,118
111
first month, and then fall to a mean of 30 mcg/L by 1 year of age. The Some of the differences may be explained by the younger mean cell age
amount of stainable iron in the marrow at birth is small but increases in the newborn, but others seem to be properties of the fetal cell. The
in both term and premature infants during the first weeks after birth. glucose consumption in newborn red cells is lower than that in adult
Stainable marrow iron begins to decrease after 2 months and is gone by red cells. Elevated levels of glucose phosphate isomerase, glyceralde-
119
112
4 to 6 months in term infants and earlier in premature infants. Iron is hyde-3-phosphate dehydrogenase, phosphoglycerate kinase, and eno-
preferentially allocated to erythropoiesis if the availability of iron is lim- lase beyond those explainable by the young cell age have been found in
113
ited. This makes the availability of adequate iron particularly impor- neonatal cells. 115,120 The level of phosphofructokinase is low in red cells
tant to avoid iron lack in the brain, heart, and skeletal muscle. of term and premature infants. 115,120,121 The pentose phosphate shunt
is active in red cells of term and premature infants, but glutathione
122
Red Cell Functions instability leads to a heightened susceptibility to oxidant injury. The
Oxygen Delivery The oxygen affinity of cord blood is greater than that result of oxidant stress is depletion of adenosine triphosphate (ATP) and
of maternal blood, because the affinity of Hgb F for 2,3-bisphosphoglyc- adenine nucleotides leading to iron release, denaturing of membrane
erate (2,3-BPG) is less than that of Hgb A. Levels of 2,3-BPG are lower proteins, and hemoglobin and membrane peroxidation. The levels
114
123
in newborn red cells than in adult cells and even more decreased in of ATP and adenosine diphosphate (ADP) are higher in the red cells
the red cells of premature infants, and this low 2,3-BPG level further of term and preterm infants, but may merely reflect the younger age
115
121
heightens the oxygen affinity of newborn red cells. Consequently, the of the erythrocyte population. Finally, lower-than-adult activities have
red cell oxygen equilibrium curve of the newborn is shifted to the left of been found for several other red cell enzymes, including cytochrome B
5
that of the adult (Fig. 7–3). The mean partial pressure of oxygen (pO ) at reductase and glutathione peroxidase. 125
124
2
which hemoglobin is 50 percent saturated with oxygen at 1 day of age in Membrane The membrane of the newborn red cell also is dif-
term infants is 19.4 ± 1.8 torr, as compared with the normal adult value ferent from that of the adult red cell. Ouabain-sensitive adenosine
116
of 27.0 ± 1.1 torr. This results in a decrease in the oxygen released at triphosphatase (ATPase) is decreased, and active potassium influx
126
the tissue level, as shown in Fig. 7–3. As the partial pressure of oxygen is significantly less in neonatal red cells. Newborn cells are more
127
Kaushansky_chapter 07_p0097-0118.indd 104 9/18/15 10:13 PM