
Page 639 - Clinical Hematology_ Theory _ Procedures ( PDFDrive )
P. 639
CHAPTER 30 ■ Instrumentation in Hematology 623
Data Analysis
Data are plotted on a histogram. Populations o similar cells
orm discrete and characteristic two-dimensional “clusters”
o scatter when the orward and side scatters are plotted
against each other.
Most hematological samples contain multiple cell popula-
tions. It is necessary to rst identi y the population o interest
or urther analysis. Whole blood is commonly used or plate-
let and erythrocyte assays. Data collected by the f ow cytometer
can be displayed as a 1-parameter histogram or as 2-parameter
plots. A 1-parameter histogram is described as either the per-
centage o cells within a set o markers or as the mean f uores-
cent intensity o a population. A 2-parameter plot is usually
divided into our quadrants, each containing a percentage o
the total population. T is is used to distinguish between f uo-
rescent and nonf uorescent cells. It also de nes the expression
and nonexpression o a cell molecule marked by a f uorescent
antibody or other f uorochrome. It is o en necessary to ana-
lyze a single population within several populations and debris.
FIGURE 30.5 Forward light scatter (FSC) versus side light scatter Electronic gating allows isolation o a speci c cluster o cells
(SSC) o normal peripheral blood. Electronic regions (gates) have or analysis. Gating is a so ware eature used to restrict analy-
been set to identi y lymphocytes (R1), monocytes (R2), and granu- sis to a particular population. A gate is created by drawing a
locytes (R3). (Reprinted rom McCoy JP. Flow cytometry, Am Assoc graphic boundary (Fig. 30.5) around a population o cells.
Clin Chem Clin Lab News, 29(9):8–10, 2003, with permission.) Quadrant markers divide two-parameter plots into
our sections called quadrants. T e quadrants are used to
proportional to cell size and side scatter to cytoplasmic distinguish negative, single-positive, and double-positive
granularity. Granulocytes have a much larger side-scattered populations rom one another (Fig. 30.6). A negative popu-
light signal than do lymphocytes. lation is located in the lower le (LL) quadrant.
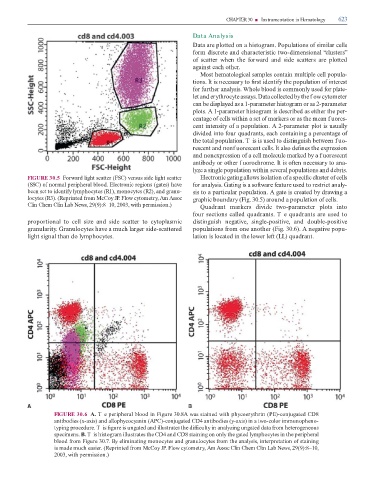
FIGURE 30.6 A. T e peripheral blood in Figure 30.8A was stained with phycoerythrin (PE)-conjugated CD8
antibodies (x-axis) and allophycocyanin (APC)-conjugated CD4 antibodies (y-axis) in a two-color immunopheno-
typing procedure. T is gure is ungated and illustrates the di culty in analyzing ungated data rom heterogeneous
specimens. B. T is histogram illustrates the CD4 and CD8 staining on only the gated lymphocytes in the peripheral
blood rom Figure 30.7. By eliminating monocytes and granulocytes rom the analysis, interpretation o staining
is made much easier. (Reprinted rom McCoy JP. Flow cytometry, Am Assoc Clin Chem Clin Lab News, 29(9):8–10,
2003, with permission.)