
Page 644 - Clinical Hematology_ Theory _ Procedures ( PDFDrive )
P. 644
628 PART 8 ■ Fundamentals of Hematological Analysis
o the right side o the curve that is excluded represents
grouped or clumped erythrocytes.
Te RDW is calculated by dividing the SD by the mean o
the red cell size distribution.
) Microcytic Macrocytic SD
s RDW = ×100
l
l red blood red blood
e Mean size
c
cells cells
f
o
r Te RDW is expressed numerically as the coe cient o
e
b
m variation percentage. T e normal range is 11.5% to 14.5%.
u
n Abnormalities can be observed on the high side but no
(
s
t abnormalities have been noted on the low side. T e RDW
n
e
v is increased above the normal limits in iron de ciency,
e
l
a vitamin B de ciency, and olic acid de ciency. In the
t 12
To hemoglobinopathies, the RDW is increased in proportion
to the degree o anemia that accompanies the hemoglobin
disorder.
Relationship of RDW and MCV
Quantitative descriptors o erythrocyte size include both the
60 120
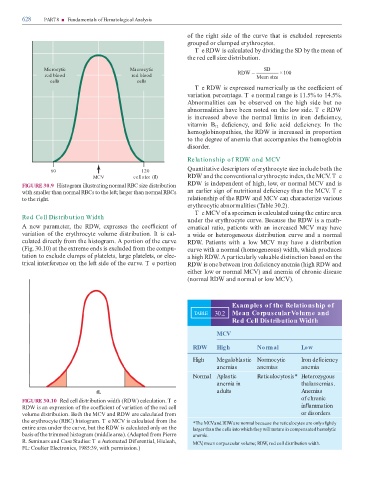
MCV cell size (fl) RDW and the conventional erythrocyte index, the MCV. T e
FIGURE 30.9 Histogram illustrating normal RBC size distribution RDW is independent o high, low, or normal MCV and is
with smaller than normal RBCs to the le ; larger than normal RBCs an earlier sign o nutritional de ciency than the MCV. T e
to the right. relationship o the RDW and MCV can characterize various
erythrocytic abnormalities ( able 30.2).
Te MCV o a specimen is calculated using the entire area
Red Cell Distribution Width
under the erythrocyte curve. Because the RDW is a math-
A new parameter, the RDW, expresses the coe cient o ematical ratio, patients with an increased MCV may have
variation o the erythrocyte volume distribution. It is cal- a wide or heterogeneous distribution curve and a normal
culated directly rom the histogram. A portion o the curve RDW. Patients with a low MCV may have a distribution
(Fig. 30.10) at the extreme ends is excluded rom the compu- curve with a normal (homogeneous) width, which produces
tation to exclude clumps o platelets, large platelets, or elec- a high RDW. A particularly valuable distinction based on the
trical inter erence on the le side o the curve. T e portion RDW is one between iron de ciency anemia (high RDW and
either low or normal MCV) and anemia o chronic disease
(normal RDW and normal or low MCV).
Examples of the Relationship of
s TABLE 30.2 Mean Corpuscular Volume and
l
l
e
c Red Cell Distribution Width
f
o
.
o MCV
n
e
v
i
t
a RDW High Normal Low
l
Re
High Megaloblastic Normocytic Iron de ciency
anemias anemias anemia
Normal Aplastic Reticulocytosis* Heterozygous
anemia in thalassemias.
fL adults Anemias
FIGURE 30.10 Red cell distribution width (RDW) calculation. T e of chronic
RDW is an expression o the coe cient o variation o the red cell in ammation
volume distribution. Both the MCV and RDW are calculated rom or disorders
the erythrocyte (RBC) histogram. T e MCV is calculated rom the * The MCV and RDW are normal because the reticulocytes are only slightly
entire area under the curve, but the RDW is calculated only on the larger than the cells into which they will mature in compensated hemolytic
basis o the trimmed histogram (middle area). (Adapted rom Pierre anemia.
R. Seminars and Case Studies: T e Automated Dif erential, Hialeah, MCV mean corpuscular volume; RDW, red cell distribution width.
,
FL: Coulter Electronics, 1985:39, with permission.)