Page 643 - Clinical Hematology_ Theory _ Procedures ( PDFDrive )
P. 643

CHAPTER 30  ■  Instrumentation in Hematology                             627


                                                                                                                               General Histogram Characteristics


                                                                                                                               Histograms are graphic representations o  cell  requencies

                                                                                                                               versus sizes. In a homogeneous cell population, the curve

                                                                                                                               assumes a symmetrical bell-shaped or Gaussian distribution.

                                                                                                                               A wide or more f attened curve is seen when the standard

                                                                                                                               deviation (SD)  rom the mean is increased. Histograms not

                                                                                                                               only provide in ormation about erythrocyte, leukocyte, and

                                                                                                                               platelet  requency and their distribution about the mean but

                                                                                                                               also depict the presence o  subpopulations.

                                                                                                                                    Histograms provide a means o  comparing the sizes o  a

                                                                                                                               patient’s cells with those o  normal population’s. Shi  s in one

                                                                                                                               direction or the other can be o  diagnostic importance. T e

                                                                                                                               position o  the curve on the x-axis ref ects the cell size. In

                                                                                                                               the Coulter system, the size (volume in  emtoliters) is repre-


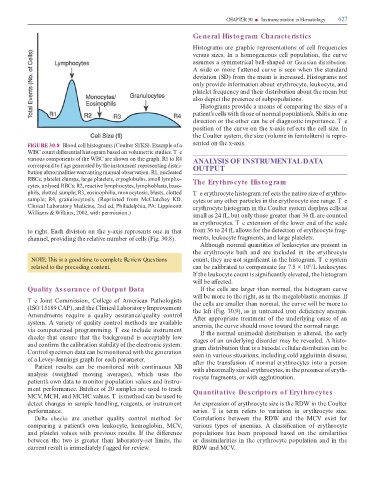
                   FIGURE 30.8  Blood cell histograms (Coulter S  KS). Example o  a                                            sented on the x-axis.

                   WBC count di  erential histogram based on volumetric studies. T e
                   various components o  the WBC are shown on the graph. R1 to R4                                              ANALYSIS OF INSTRUMENTAL DATA

                   correspond to f ags generated by the instrument representing distri-                                        OUTPUT

                   bution abnormalities warranting manual observation. R1, nucleated

                   RBCs, platelet clumps, large platelets, cryoglobulin, small lympho-                                         The Erythrocyte Histogram
                   cytes, unlysed RBCs; R2, reactive lymphocytes, lymphoblasts, baso-

                   phils, clotted sample; R3, eosinophilia, monocytosis, blasts, clotted                                       Te erythrocyte histogram ref ects the native size o  erythro-

                   sample;  R4,  granulocytosis.  (Reprinted   rom  McClatchey  KD.                                            cytes or any other particles in the erythrocyte size range. T e

                   Clinical Laboratory Medicine, 2nd ed, Philadelphia, PA: Lippincott                                          erythrocyte histogram in the Coulter system displays cells as
                   Williams & Wilkins, 2002, with permission.)
                                                                                                                               small as 24  L, but only those greater than 36  L are counted

                                                                                                                               as erythrocytes. T e extension o  the lower end o  the scale


                   to right. Each division on the y-axis represents one in that                                                 rom 36 to 24  L allows  or the detection o  erythrocyte  rag-

                   channel, providing the relative number o  cells (Fig. 30.8).                                                ments, leukocyte  ragments, and large platelets.
                                                                                                                                    Although normal quantities o  leukocytes are present in

                                                                                                                               the  erythrocyte  bath  and  are  included  in  the  erythrocyte

                     NOTE: This is a good time to complete Review Questions                                                    count, they are not signi  cant in the histogram. T e system

                     related to the preceding content.                                                                         can be calibrated to compensate  or 7.5 × 10 /L leukocytes.
                                                                                                                                                                                                           9
                                                                                                                               I  the leukocyte count is signi  cantly elevated, the histogram

                                                                                                                               will be a  ected.

                   Quality Assurance of Output Data                                                                                 I  the cells are larger than normal, the histogram curve

                                                                                                                               will be more to the right, as in the megaloblastic anemias. I
                   T e  Joint  Commission,  College  o   American  Pathologists                                                the cells are smaller than normal, the curve will be more to

                   (ISO 15189 CAP), and the Clinical Laboratory Improvement                                                    the le   (Fig. 30.9), as in untreated iron de  ciency anemia.

                   Amendments  require  a  quality  assurance/quality  control                                                 A  er appropriate treatment o  the underlying cause o  an

                   system. A variety o  quality control methods are available                                                  anemia, the curve should move toward the normal range.

                   via computerized programming. T ese include instrument                                                           I  the normal unimodal distribution is altered, the early

                   checks  that  ensure  that  the  background  is  acceptably  low                                            stages o  an underlying disorder may be revealed. A histo-

                   and con  rm the calibration stability o  the electronic system.                                             gram distribution that is a bimodal cellular distribution can be

                   Control specimen data can be monitored with the generation                                                  seen in various situations, including cold agglutinin disease,

                   o  a Levey-Jennings graph  or each parameter.                                                               a  er the trans usion o  normal erythrocytes into a person

                        Patient  results  can  be  monitored  with  continuous  XB                                             with abnormally sized erythrocytes, in the presence o  eryth-

                   analysis  (weighted  moving  averages),  which  uses  the                                                   rocyte  ragments, or with agglutination.

                   patient’s own data to monitor population values and instru-

                   ment per ormance. Batches o  20 samples are used to track                                                   Quantitative Descriptors of Erythrocytes

                   MCV, MCH, and MCHC values. T is method can be used to

                   detect changes in sample handling, reagents, or instrument                                                  An expression o  erythrocyte size is the RDW in the Coulter

                   per ormance.                                                                                                series.  T is  term  re ers  to  variation  in  erythrocyte  size.

                        Delta  checks  are  another  quality  control  method   or                                             Correlations  between  the  RDW  and  the  MCV  exist   or

                   comparing  a  patient’s  own  leukocyte,  hemoglobin,  MCV,                                                 various  types  o   anemias.  A  classi  cation  o   erythrocyte

                   and  platelet  values  with  previous  results.  I   the  di  erence                                        populations  has  been  proposed  based  on  the  similarities

                   between  the  two  is  greater  than  laboratory-set  limits,  the                                          or dissimilarities in the erythrocyte population and in the

                   current result is immediately f agged  or review.                                                           RDW and MCV.
   638   639   640   641   642   643   644   645   646   647   648