
Page 646 - Clinical Hematology_ Theory _ Procedures ( PDFDrive )
P. 646
630 PART 8 ■ Fundamentals of Hematological Analysis
s
l
e l e
m c
u f
l o
Vo . o
n
e
v i t a l
Monocyte s Eos inophils Re 5 10 fL
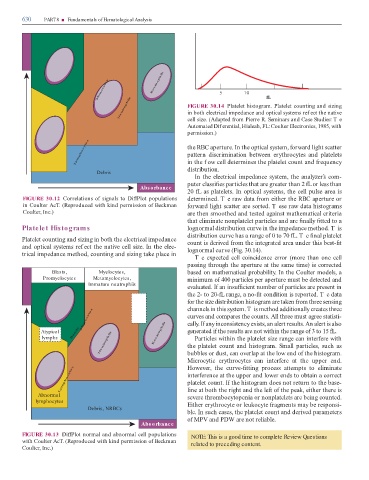
Ne utrophils FIGURE 30.14 Platelet histogram. Platelet counting and sizing
in both electrical impedance and optical systems ref ect the native
cell size. (Adapted rom Pierre R. Seminars and Case Studies: T e
Automated Dif erential, Hialeah, FL: Coulter Electronics, 1985, with
permission.)
L ymphocyte s the RBC aperture. In the optical system, orward light scatter
pattern discrimination between erythrocytes and platelets
in the f ow cell determines the platelet count and requency
distribution.
Debris
In the electrical impedance system, the analyzer’s com-
puter classi es particles that are greater than 2 L or less than
Abs orbance
20 L as platelets. In optical systems, the cell pulse area is
FIGURE 30.12 Correlations o signals to Di Plot populations determined. T e raw data rom either the RBC aperture or
in Coulter Ac . (Reproduced with kind permission o Beckman orward light scatter are sorted. T ese raw data histograms
Coulter, Inc.) are then smoothed and tested against mathematical criteria
that eliminate nonplatelet particles and are nally tted to a
Platelet Histograms lognormal distribution curve in the impedance method. T is
distribution curve has a range o 0 to 70 L. T e nal platelet
Platelet counting and sizing in both the electrical impedance count is derived rom the integrated area under this best- t
and optical systems ref ect the native cell size. In the elec- lognormal curve (Fig. 30.14).
trical impedance method, counting and sizing take place in
Te expected cell coincidence error (more than one cell
passing through the aperture at the same time) is corrected
Blasts, Myelocytes, based on mathematical probability. In the Coulter models, a
e Promyelocytes Metamyelocytes, minimum o 400 particles per aperture must be detected and
m Immature neutrophils
u evaluated. I an insu cient number o particles are present in
l
Vo the 2- to 20- L range, a no- t condition is reported. T e data
s
l
e i
r h or the size distribution histogram are taken rom three sensing
u p
o t a n m i channels in this system. T is method additionally creates three
Monocyte s Im s eo curves and compares the counts. All three must agree statisti-
cally. I any inconsistency exists, an alert results. An alert is also
Atypical Ba nds Eos inophils generated i the results are not within the range o 3 to 15 L.
Ne utrophils the platelet count and histogram. Small particles, such as
lymphs Particles within the platelet size range can inter ere with
bubbles or dust, can overlap at the low end o the histogram.
Microcytic erythrocytes can inter ere at the upper end.
However, the curve- tting process attempts to eliminate
L ymphocyte s inter erence at the upper and lower ends to obtain a correct
platelet count. I the histogram does not return to the base-
Abnormal line at both the right and the le o the peak, either there is
severe thrombocytopenia or nonplatelets are being counted.
lymphocytes Either erythrocyte or leukocyte ragments may be responsi-
Debris, NRBCs
ble. In such cases, the platelet count and derived parameters
o MPV and PDW are not reliable.
Abs orbance
FIGURE 30.13 Di Plot normal and abnormal cell populations NOTE: This is a good time to complete Review Questions
with Coulter Ac . (Reproduced with kind permission o Beckman related to preceding content.
Coulter, Inc.)