
Page 647 - Clinical Hematology_ Theory _ Procedures ( PDFDrive )
P. 647
CHAPTER 30 ■ Instrumentation in Hematology 631
Derived Platelet Parameters Mean Platelet Volume in
TABLE 30.4
Platelet size has been measured or more than a decade by Selected Disorders
either micrometry or f ow cytometry methods. However, siz-
ing in ormation rom data obtained rom whole blood speci- Decreased MPV Increased MPV
mens and the application o computer technology now make it Aplastic anemia Idiopathic thrombocytopenic
possible or additional parameters to be generated instrumen- purpura
tally. T e Coulter model systems yield the additional parame- Megaloblastic anemia After splenectomy
ters o MPV and PDW. T ese parameters are derived rom the
platelet histogram and allow or a size comparison between a Wiskott-Aldrich syndrome Sickle cell anemia
patient’s specimen and the normal population’s. Size compari- After chemotherapy
sons are use ul as an indicator o certain disorders. MPV mean platelet volume.
,
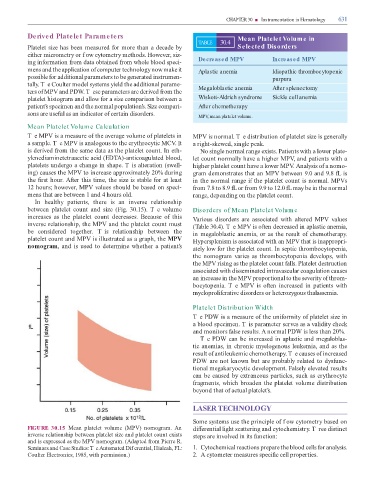
Mean Platelet Volum e Calculation
T e MPV is a measure o the average volume o platelets in MPV is normal. T e distribution o platelet size is generally
a sample. T e MPV is analogous to the erythrocytic MCV. It a right-skewed, single peak.
is derived rom the same data as the platelet count. In eth- No single normal range exists. Patients with a lower plate-
ylenediaminetetraacetic acid (ED A)-anticoagulated blood, let count normally have a higher MPV, and patients with a
platelets undergo a change in shape. T is alteration (swell- higher platelet count have a lower MPV. Analysis o a nomo-
ing) causes the MPV to increase approximately 20% during gram demonstrates that an MPV between 9.0 and 9.8 L is
the rst hour. A er this time, the size is stable or at least in the normal range i the platelet count is normal. MPVs
12 hours; however, MPV values should be based on speci- rom 7.8 to 8.9 L or rom 9.9 to 12.0 L may be in the normal
mens that are between 1 and 4 hours old. range, depending on the platelet count.
In healthy patients, there is an inverse relationship
between platelet count and size (Fig. 30.15). T e volume Disorders of Mean Platelet Volum e
increases as the platelet count decreases. Because o this Various disorders are associated with altered MPV values
inverse relationship, the MPV and the platelet count must ( able 30.4). T e MPV is o en decreased in aplastic anemia,
be considered together. T is relationship between the in megaloblastic anemia, or as the result o chemotherapy.
platelet count and MPV is illustrated as a graph, the MPV Hypersplenism is associated with an MPV that is inappropri-
nomogram, and is used to determine whether a patient’s ately low or the platelet count. In septic thrombocytopenia,
the nomogram varies as thrombocytopenia develops, with
the MPV rising as the platelet count alls. Platelet destruction
associated with disseminated intravascular coagulation causes
an increase in the MPV proportional to the severity o throm-
bocytopenia. T e MPV is o en increased in patients with
myeloproli erative disorders or heterozygous thalassemia.
Platelet Distribution Width
T e PDW is a measure o the uni ormity o platelet size in
a blood specimen. T is parameter serves as a validity check
and monitors alse results. A normal PDW is less than 20%.
T e PDW can be increased in aplastic and megaloblas-
tic anemias, in chronic myelogenous leukemia, and as the
result o antileukemic chemotherapy. T e causes o increased
PDW are not known but are probably related to dys unc-
tional megakaryocytic development. Falsely elevated results
can be caused by extraneous particles, such as erythrocyte
ragments, which broaden the platelet volume distribution
beyond that o actual platelet’s.
LASER TECHNOLOGY
Some systems use the principle o f ow cytometry based on
FIGURE 30.15 Mean platelet volume (MPV) nomogram. An di erential light scattering and cytochemistry. T ree distinct
inverse relationship between platelet size and platelet count exists steps are involved in its unction:
and is expressed as the MPV nomogram. (Adapted rom Pierre R.
Seminars and Case Studies: T e Automated Dif erential, Hialeah, FL: 1. Cytochemical reactions prepare the blood cells or analysis.
Coulter Electronics, 1985, with permission.) 2. A cytometer measures speci c cell properties.