
Page 648 - Clinical Hematology_ Theory _ Procedures ( PDFDrive )
P. 648
632 PART 8 ■ Fundamentals of Hematological Analysis
3. Algorithms convert these measurements into amil-
iar results or cell classi cation, cell count, cell size, and
hemoglobinization.
T e instrument’s sampling mechanism divides blood
samples into aliquots that are treated in our separate reac-
tion chambers:
1. Hemoglobin
2. Red cell/platelet
3. Peroxidase
4. Basophil/lobularity or nuclear channel
Red Blood Cells/ Platelets
T e RBC/platelet channel uses a laser-based optical assembly
that is shared with the basophil/lobularity channel. A bu -
ered reagent isovolumetrically spheres and xes RBCs and
platelets. T e light scattered at low and high angles simul-
taneously measures RBC volume (size) and optical density
(hemoglobin concentration) o each cell. T e signal pairs are
trans ormed by a computer into a cytogram and two histo-
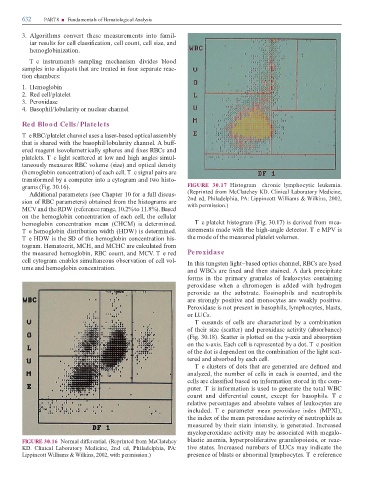
grams (Fig. 30.16). FIGURE 30.17 Histogram—chronic lymphocytic leukemia.
Additional parameters (see Chapter 10 or a ull discus- (Reprinted rom McClatchey KD. Clinical Laboratory Medicine,
sion o RBC parameters) obtained rom the histograms are 2nd ed, Philadelphia, PA: Lippincott Williams & Wilkins, 2002,
with permission.)
MCV and the RDW (re erence range, 10.2% to 11.8%). Based
on the hemoglobin concentration o each cell, the cellular
hemoglobin concentration mean (CHCM) is determined. T e platelet histogram (Fig. 30.17) is derived rom mea-
T e hemoglobin distribution width (HDW) is determined. surements made with the high-angle detector. T e MPV is
T e HDW is the SD o the hemoglobin concentration his- the mode o the measured platelet volumes.
togram. Hematocrit, MCH, and MCHC are calculated rom
the measured hemoglobin, RBC count, and MCV. T e red Peroxidase
cell cytogram enables simultaneous observation o cell vol- In this tungsten light–based optics channel, RBCs are lysed
ume and hemoglobin concentration. and WBCs are xed and then stained. A dark precipitate
orms in the primary granules o leukocytes containing
peroxidase when a chromogen is added with hydrogen
peroxide as the substrate. Eosinophils and neutrophils
are strongly positive and monocytes are weakly positive.
Peroxidase is not present in basophils, lymphocytes, blasts,
or LUCs.
T ousands o cells are characterized by a combination
o their size (scatter) and peroxidase activity (absorbance)
(Fig. 30.18). Scatter is plotted on the y-axis and absorption
on the x-axis. Each cell is represented by a dot. T e position
o the dot is dependent on the combination o the light scat-
tered and absorbed by each cell.
Te clusters o dots that are generated are de ned and
analyzed, the number o cells in each is counted, and the
cells are classi ed based on in ormation stored in the com-
puter. T is in ormation is used to generate the total WBC
count and di erential count, except or basophils. T e
relative percentages and absolute values o leukocytes are
included. T e parameter mean peroxidase index (MPXI),
the index o the mean peroxidase activity o neutrophils as
measured by their stain intensity, is generated. Increased
myeloperoxidase activity may be associated with megalo-
FIGURE 30.16 Normal di erential. (Reprinted rom McClatchey blastic anemia, hyperproli erative granulopoiesis, or reac-
KD. Clinical Laboratory Medicine, 2nd ed, Philadelphia, PA: tive states. Increased numbers o LUCs may indicate the
Lippincott Williams & Wilkins, 2002, with permission.) presence o blasts or abnormal lymphocytes. T e re erence