
Page 645 - Clinical Hematology_ Theory _ Procedures ( PDFDrive )
P. 645
CHAPTER 30 ■ Instrumentation in Hematology 629
s l
Classi cation of Anemias Based l e
TABLE 30.3 on Red Cell Distribution Width c f o
and Mean Corpuscular Volume . o
n
e
MCV v i t
a
l
Re
RDW High Normal Low
fL
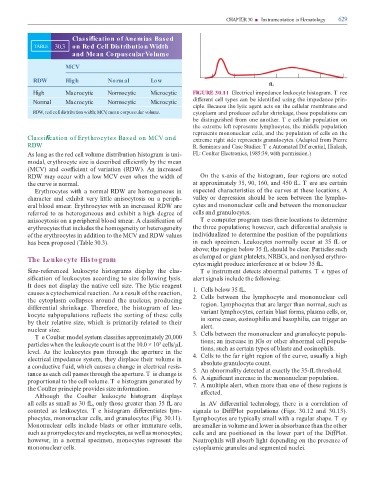
High Macrocytic Normocytic Microcytic FIGURE 30.11 Electrical impedance leukocyte histogram. T ree
di erent cell types can be identi ed using the impedance prin-
Normal Macrocytic Normocytic Microcytic
ciple. Because the lytic agent acts on the cellular membrane and
,
RDW, red cell distribution width; MCV mean corpuscular volume. cytoplasm and produces cellular shrinkage, these populations can
be distinguished rom one another. T e cellular population on
the extreme le represents lymphocytes, the middle population
represents mononuclear cells, and the population o cells on the
Classi cation of Erythrocytes Based on MCV and extreme right side represents granulocytes. (Adapted rom Pierre
RDW R. Seminars and Case Studies: T e Automated Dif erential, Hialeah,
As long as the red cell volume distribution histogram is uni- FL: Coulter Electronics, 1985:39, with permission.)
modal, erythrocyte size is described e ciently by the mean
(MCV) and coe cient o variation (RDW). An increased
RDW may occur with a low MCV even when the width o On the x-axis o the histogram, our regions are noted
the curve is normal. at approximately 35, 90, 160, and 450 L. T ere are certain
Erythrocytes with a normal RDW are homogeneous in expected characteristics o the curves at these locations. A
character and exhibit very little anisocytosis on a periph- valley or depression should be seen between the lympho-
eral blood smear. Erythrocytes with an increased RDW are cytes and mononuclear cells and between the mononuclear
re erred to as heterogeneous and exhibit a high degree o cells and granulocytes.
anisocytosis on a peripheral blood smear. A classi cation o T e computer program uses these locations to determine
erythrocytes that includes the homogeneity or heterogeneity the three populations; however, each di erential analysis is
o the erythrocytes in addition to the MCV and RDW values individualized to determine the position o the populations
has been proposed ( able 30.3). in each specimen. Leukocytes normally occur at 35 L or
above; the region below 35 L should be clear. Particles such
The Leukocyte Histogram as clumped or giant platelets, NRBCs, and nonlysed erythro-
cytes might produce inter erence at or below 35 L.
Size-re erenced leukocyte histograms display the clas- T e instrument detects abnormal patterns. T e types o
si ication o leukocytes according to size ollowing lysis. alert signals include the ollowing:
It does not display the native cell size. he lytic reagent 1. Cells below 35 L.
causes a cytochemical reaction. As a result o the reaction, 2. Cells between the lymphocyte and mononuclear cell
the cytoplasm collapses around the nucleus, producing region. Lymphocytes that are larger than normal, such as
di erential shrinkage. here ore, the histogram o leu- variant lymphocytes, certain blast orms, plasma cells, or,
kocyte subpopulations re lects the sorting o these cells in some cases, eosinophilia and basophilia, can trigger an
by their relative size, which is primarily related to their
nuclear size. alert.
T e Coulter model system classi es approximately 20,000 3. Cells between the mononuclear and granulocyte popula-
particles when the leukocyte count is at the 10.0 × 10 cells/µL tions; an increase in IGs or other abnormal cell popula-
3
tions, such as certain types o blasts and eosinophils.
level. As the leukocytes pass through the aperture in the 4. Cells to the ar right region o the curve, usually a high
electrical impedance system, they displace their volume in absolute granulocyte count.
a conductive f uid, which causes a change in electrical resis- 5. An abnormality detected at exactly the 35- L threshold.
tance as each cell passes through the aperture. T is change is 6. A signi cant increase in the mononuclear population.
proportional to the cell volume. T e histogram generated by 7. A multiple alert, when more than one o these regions is
the Coulter principle provides size in ormation. a ected.
Although the Coulter leukocyte histogram displays
all cells as small as 30 L, only those greater than 35 L are In AV di erential technology, there is a correlation o
counted as leukocytes. T e histogram di erentiates lym- signals to Di Plot populations (Figs. 30.12 and 30.13).
phocytes, mononuclear cells, and granulocytes (Fig. 30.11). Lymphocytes are typically small with a regular shape. T ey
Mononuclear cells include blasts or other immature cells, are smaller in volume and lower in absorbance than the other
such as promyelocytes and myelocytes, as well as monocytes; cells and are positioned in the lower part o the Di Plot.
however, in a normal specimen, monocytes represent the Neutrophils will absorb light depending on the presence o
mononuclear cells. cytoplasmic granules and segmented nuclei.