Page 649 - Clinical Hematology_ Theory _ Procedures ( PDFDrive )
P. 649

CHAPTER 30  ■  Instrumentation in Hematology                             633


                                                                                                                               a low pH, the membranes and cytoplasm o  speci  c leuko-

                                                                                                                               cytes, neutrophils, eosinophils, lymphocytes, and monocytes

                                                                                                                               disintegrate and only the bare nuclei remain.

                                                                                                                                    T e nuclear channel cytometer distinguishes leukocytes

                                                                                                                               by di  erences in nuclear shape and counts basophils. T is

                                                                                                                               laser-based cytometer measures light scattering at two di -

                                                                                                                                erent angles, low (0 to 5 degrees) and high (5 to 15 degrees).

                                                                                                                               Low-angle scatter measures size, and the low-angle scatter o

                                                                                                                               intact basophils is much greater than the bare nuclei o  other

                                                                                                                               leukocytes. A   xed horizontal threshold separates basophils

                                                                                                                                rom the nuclei o  other leukocytes (Fig. 30.18). High-angle

                                                                                                                               scatter is responsive to the lobularity o  nuclei. T e more lob-

                                                                                                                               ulated the nuclei, the larger the high-angle signal.

                                                                                                                                    On the cytogram, polymorphonuclear neutrophil (PMN)

                                                                                                                               appears on the right and mononuclear nuclei (MN) appear

                                                                                                                               on the le   with a valley between them. A vertical threshold

                                                                                                                               separates the two clusters. T e ratio o  PMN:MN, the lobu-

                                                                                                                               larity index (LI), is an index o  the degree o  PMN nuclear

                                                                                                                               segmentation;  a  low  value  suggests  a  le    shi  .  Blast  cells

                                                                                                                               appear to the le   o  the normal mononuclear cells on the


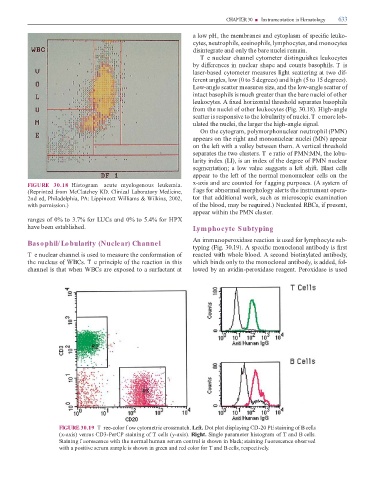
                   FIGURE  30.18  Histogram—acute  myelogenous  leukemia.                                                      x-axis and are counted  or f agging purposes. (A system o

                   (Reprinted  rom McClatchey KD. Clinical Laboratory Medicine,                                                f ags  or abnormal morphology alerts the instrument opera-

                   2nd ed, Philadelphia, PA: Lippincott Williams & Wilkins, 2002,                                              tor that additional work, such as microscopic examination
                   with permission.)                                                                                           o  the blood, may be required.) Nucleated RBCs, i  present,

                                                                                                                               appear within the PMN cluster.

                   ranges o  0% to 3.7%  or LUCs and 0% to 5.4%  or HPX

                   have been established.                                                                                      Lymphocyte Subtyping


                   Basophil/ Lobularity (Nuclear) Channel                                                                      An immunoperoxidase reaction is used  or lymphocyte sub-
                                                                                                                               typing (Fig. 30.19). A speci  c monoclonal antibody is   rst

                   T e nuclear channel is used to measure the con ormation o                                                   reacted with whole blood. A second biotinylated antibody,

                   the nucleus o  WBCs. T e principle o  the reaction in this                                                  which binds only to the monoclonal antibody, is added,  ol-

                   channel is that when WBCs are exposed to a sur actant at                                                    lowed by an avidin-peroxidase reagent. Peroxidase is used


                                        FIGURE 30.19  T ree-color f ow cytometric crossmatch. Le  . Dot plot displaying CD-20 PE staining o  B cells

                                        (x-axis) versus CD3-PerCP staining o     cells (y-axis). Right. Single parameter histogram o     and B cells.
                                        Staining f uorescence with the normal human serum control is shown in black; staining f uorescence observed

                                        with a positive serum sample is shown in green and red color  or    and B cells, respectively.
   644   645   646   647   648   649   650   651   652   653   654