
Page 680 - Clinical Hematology_ Theory _ Procedures ( PDFDrive )
P. 680
664 PART 8 ■ Fundamentals of Hematological Analysis
Targeted Sequencing
Whole genome and whole-exome sequencing are available.
In many instances, sequencing o speci c genes or genomic
regions is pre erred. argeted sequencing is less expensive and
yields much higher coverage o genomic regions o interest.
Sequence panels that target hundreds o genomic “hotspots”
or disease-causing mutations are being developed. argeted
sequencing o either individual genes or whole panels o
genomic regions aids in rapid diagnosis o many genetic dis-
orders. T is can aid in therapy decision making.
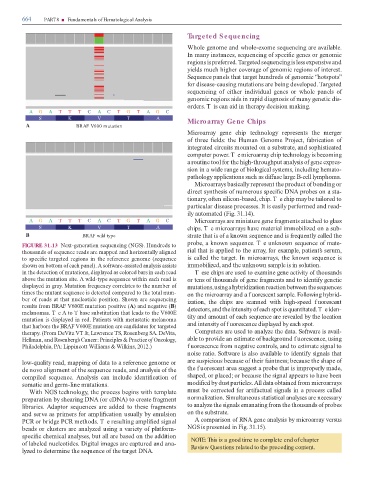
A G A T T T C A C T G T A G C
S K V T A Microarray Gene Chips
A BRAF V600 mutation
Microarray gene chip technology represents the merger
o three elds: the Human Genome Project, abrication o
integrated circuits mounted on a substrate, and sophisticated
computer power. T e microarray chip technology is becoming
a routine tool or the high-throughput analysis o gene expres-
sion in a wide range o biological systems, including hemato-
pathology applications such as di use large B-cell lymphoma.
Microarrays basically represent the product o bonding or
direct synthesis o numerous speci c DNA probes on a sta-
tionary, o en silicon-based, chip. T e chip may be tailored to
particular disease processes. It is easily per ormed and read-
ily automated (Fig. 31.14).
A G A T T T C A C T G T A G C Microarrays are miniature gene ragments attached to glass
S K V T A chips. T e microarrays have material immobilized on a sub-
B BRAF wild type strate that is o a known sequence and is requently called the
FIGURE 31.13 Next-generation sequencing (NGS). Hundreds to probe, a known sequence. T e unknown sequence o mate-
thousands o sequence reads are mapped and horizontally aligned rial that is applied to the array, or example, patient’s serum,
to speci c targeted regions in the re erence genome (sequence is called the target. In microarrays, the known sequence is
shown on bottom o each panel). A so ware-assisted analysis assists immobilized, and the unknown sample is in solution.
in the detection o mutations, displayed as colored bars in each read Tese chips are used to examine gene activity o thousands
above the mutation site. A wild-type sequence within each read is or tens o thousands o gene ragments and to identi y genetic
displayed in gray. Mutation requency correlates to the number o mutations, using a hybridization reaction between the sequences
times the mutant sequence is detected compared to the total num- on the microarray and a f uorescent sample. Following hybrid-
ber o reads at that nucleotide position. Shown are sequencing ization, the chips are scanned with high-speed f uorescent
results rom BRAF V600E mutation positive (A) and negative (B) detectors, and the intensity o each spot is quantitated. T e iden-
melanomas. T e A to base substitution that leads to the V600E
mutation is displayed in red. Patients with metastatic melanoma tity and amount o each sequence are revealed by the location
that harbors the BRAF V600E mutation are candidates or targeted and intensity o f uorescence displayed by each spot.
therapy. (From DeVita V Jr, Lawrence S, Rosenberg SA. DeVita, Computers are used to analyze the data. So ware is avail-
Hellman, and Rosenberg’s Cancer: Principles & Practice o Oncology, able to provide an estimate o background f uorescence, using
Philadelphia, PA: Lippincott Williams & Wilkins, 2012.) fuorescence rom negative controls, and to estimate signal to
noise ratio. So ware is also available to identi y signals that
low-quality read, mapping o data to a re erence genome or are suspicious because o their aintness; because the shape o
de novo alignment o the sequence reads, and analysis o the the f uorescent area suggest a probe that is improperly made,
compiled sequence. Analysis can include identi cation o shaped, or placed; or because the signal appears to have been
somatic and germ-line mutations. modi ed by dust particles. All data obtained rom microarrays
With NGS technology, the process begins with template must be corrected or arti actual signals in a process called
preparation by shearing DNA (or cDNA) to create ragment normalization. Simultaneous statistical analyses are necessary
libraries. Adaptor sequences are added to these ragments to analyze the signals emanating rom the thousands o probes
and serve as primers or ampli cation usually by emulsion on the substrate.
PCR or bridge PCR methods. T e resulting ampli ed signal A comparison o RNA gene analysis by microarray versus
beads or clusters are analyzed using a variety o plat orm- NGS is presented in Fig. 31.15).
speci c chemical analyses, but all are based on the addition NOTE: This is a good time to complete end of chapter
o labeled nucleotides. Digital images are captured and ana- Review Questions related to the preceding content.
lyzed to determine the sequence o the target DNA.