
Page 681 - Clinical Hematology_ Theory _ Procedures ( PDFDrive )
P. 681
CHAPTER 31 ■ Molecular Diagnostic Techniques and Applications 665
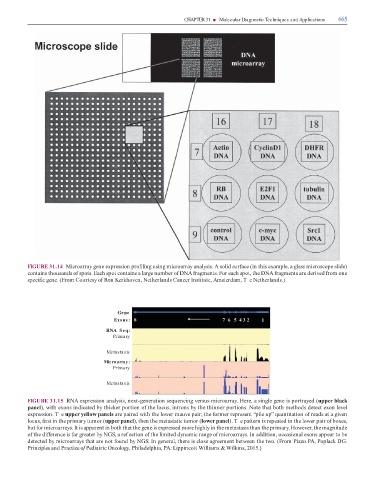
FIGURE 31.14 Microarray gene expression pro ling using microarray analysis. A solid sur ace (in this example, a glass microscope slide)
contains thousands o spots. Each spot contains a large number o DNA ragments. For each spot, the DNA ragments are derived rom one
speci c gene. (From Courtesy o Ron Kerkhoven, Netherlands Cancer Institute, Amsterdam, T e Netherlands.)
Gene
Exons : 8 7 6 5 4 3 2 1
RNA Seq:
Primary
Metastasis
Microarray:
Primary
Metastasis
FIGURE 31.15 RNA expression analysis, next-generation sequencing versus microarray. Here, a single gene is portrayed (upper black
panel), with exons indicated by thicker portion o the locus, introns by the thinner portions. Note that both methods detect exon level
expression. T e upper yellow panels are paired with the lower mauve pair; the ormer represent “pile up” quantitation o reads at a given
locus, rst in the primary tumor (upper panel), then the metastatic tumor (lower panel). T e pattern is repeated in the lower pair o boxes,
but or microarrays. It is apparent in both that the gene is expressed more highly in the metastasis than the primary. However, the magnitude
o the di erence is ar greater by NGS, a ref ection o the limited dynamic range o microarrays. In addition, occasional exons appear to be
detected by microarrays that are not ound by NGS. In general, there is close agreement between the two. (From Pizzo PA, Poplack DG.
Principles and Practice o Pediatric Oncology, Philadelphia, PA: Lippincott Williams & Wilkins, 2015.)