
Page 243 - Review of Medical Microbiology and Immunology ( PDFDrive )
P. 243
mebooksfree.com
mebooksfree.com
mebooksfree.com
mebooksfree.com
mebooksfree.com mebooksfree.com mebooksfree.com mebooksfree.com H A P mebooksfree.com mebooksfree.com
mebooksfree.com
mebooksfree.com
29
T
E
R
C
Replication
mebooksfree.com
mebooksfree.com mebooksfree.com mebooksfree.com Lysogeny mebooksfree.com mebooksfree.com
CHAPTER C ONTENT S
Introduction
Relationship of Lysogeny in Bacteria to Latency in
Viral Growth Curve
Human Cells
Specific Events During the Growth Cycle
Pearls
Attachment, Penetration, & Uncoating
Self-Assessment Questions
Gene Expression & Genome Replication
Practice Questions: USMLE & Course Examinations
Assembly & Release
Virions/cell ( ) mebooksfree.com
mebooksfree.com
mebooksfree.com mebooksfree.com mebooksfree.com latent period. This cytopathic effect (CPE) culminates in mebooksfree.com
INTRODUCTION
the lysis and death of cells. CPE can be seen in the light
The viral replication cycle is described in this chapter in
microscope and, when observed, is an important initial
two different ways. The first approach is a growth curve,
step in the laboratory diagnosis of viral infection. Not all
which shows the amount of virus produced at different
times after infection. The second is a stepwise description
of the specific events within the cell during virus growth.
1000
VIRAL GROWTH CURVE
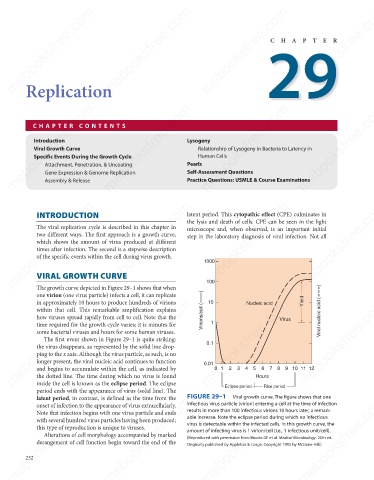
The growth curve depicted in Figure 29–1 shows that when
one virion (one virus particle) infects a cell, it can replicate 100 Nucleic acid Yield Viral nucleic acid ( )
mebooksfree.com mebooksfree.com mebooksfree.com 0.01 1 Virus mebooksfree.com mebooksfree.com
mebooksfree.com
in approximately 10 hours to produce hundreds of virions
10
within that cell. This remarkable amplification explains
how viruses spread rapidly from cell to cell. Note that the
time required for the growth cycle varies; it is minutes for
some bacterial viruses and hours for some human viruses.
The first event shown in Figure 29–1 is quite striking:
0.1
the virus disappears, as represented by the solid line drop-
ping to the x axis. Although the virus particle, as such, is no
longer present, the viral nucleic acid continues to function
and begins to accumulate within the cell, as indicated by
4
2
3
0 1
6
the dotted line. The time during which no virus is found
inside the cell is known as the eclipse period. The eclipse
Rise period
period ends with the appearance of virus (solid line). The FIGURE 29–1 Eclipse period 5 Hours 7 8 9101112
Viral growth curve. The figure shows that one
latent period, in contrast, is defined as the time from the
mebooksfree.com mebooksfree.com mebooksfree.com able increase. Note the eclipse period during which no infectious mebooksfree.com
mebooksfree.com
mebooksfree.com
infectious virus particle (virion) entering a cell at the time of infection
onset of infection to the appearance of virus extracellularly.
results in more than 100 infectious virions 10 hours later, a remark-
Note that infection begins with one virus particle and ends
with several hundred virus particles having been produced;
virus is detectable within the infected cells. In this growth curve, the
this type of reproduction is unique to viruses.
amount of infecting virus is 1 virion/cell (i.e., 1 infectious unit/cell).
Alterations of cell morphology accompanied by marked
(Reproduced with permission from Brooks GF et al. Medical Microbiology. 20th ed.
derangement of cell function begin toward the end of the
Originally published by Appleton & Lange. Copyright 1995 by McGraw-Hill.)
232
mebooksfree.com mebooksfree.com mebooksfree.com mebooksfree.com mebooksfree.com mebooksfree.com