
Page 232 - 9780077418427.pdf
P. 232
/Users/user-f465/Desktop
tiL12214_ch08_203-228.indd Page 209 9/1/10 9:45 PM user-f465
tiL12214_ch08_203-228.indd Page 209 9/1/10 9:45 PM user-f465 /Users/user-f465/Desktop
Prism
Spectrum
Band of Lines
white Red Slit N of
light Orange color
Slit N Yellow
Green
Blue
Violet
A B
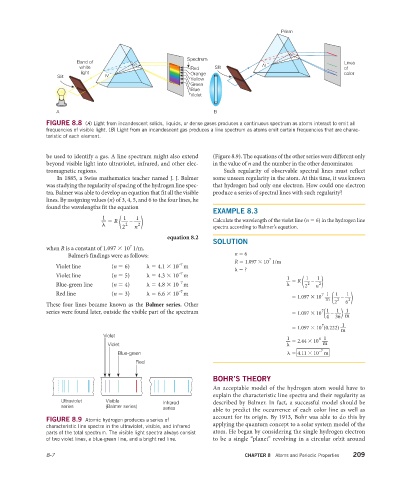
FIGURE 8.8 (A) Light from incandescent solids, liquids, or dense gases produces a continuous spectrum as atoms interact to emit all
frequencies of visible light. (B) Light from an incandescent gas produces a line spectrum as atoms emit certain frequencies that are charac-
teristic of each element.
be used to identify a gas. A line spectrum might also extend (Figure 8.9). The equations of the other series were different only
beyond visible light into ultraviolet, infrared, and other elec- in the value of n and the number in the other denominator.
tromagnetic regions. Such regularity of observable spectral lines must reflect
In 1885, a Swiss mathematics teacher named J. J. Balmer some unseen regularity in the atom. At this time, it was known
was studying the regularity of spacing of the hydrogen line spec- that hydrogen had only one electron. How could one electron
tra. Balmer was able to develop an equation that fit all the visible produce a series of spectral lines with such regularity?
lines. By assigning values (n) of 3, 4, 5, and 6 to the four lines, he
found the wavelengths fit the equation
EXAMPLE 8.3
1 _ 1 _ _
1
2)
= R – Calculate the wavelength of the violet line (n = 6) in the hydrogen line
λ ( 2 spectra according to Balmer’s equation.
2 n
equation 8.2
SOLUTION
7
when R is a constant of 1.097 × 10 1/m.
Balmer’s findings were as follows: n = 6
7
R = 1.097 × 10 1/m
–7
Violet line (n = 6) λ = 4.1 × 10 m
λ = ?
–7
Violet line (n = 5) λ = 4.3 × 10 m
1 _ = R –
1 _ _
2)
1
–7
Blue-green line (n = 4) λ = 4.8 × 10 m λ ( 2
2 n
–7
Red line (n = 3) λ = 6.6 × 10 m 7 1 _ 1 _ _
1
2)
= 1.097 × 10 –
m( 2
These four lines became known as the Balmer series. Other 2 6
7 1 _ _ 1 _
1
)
(
series were found later, outside the visible part of the spectrum = 1.097 × 10 –
4 36 m
7 1 _
= 1.097 × 10 (0.222)
m
Violet
Violet
1 _ 6 1 _
Violet λ = 2.44 × 10
Violet
m
–7
Blue-green
Blue-green λ = 4.11 × 10 m
Red
Red
BOHR’S THEORY
An acceptable model of the hydrogen atom would have to
explain the characteristic line spectra and their regularity as
Ultraviolet Visible Infrared described by Balmer. In fact, a successful model should be
Ultraviolet
Visible
Infrared
series (Balmer series) series able to predict the occurrence of each color line as well as
series
(Balmer series)
series
account for its origin. By 1913, Bohr was able to do this by
FIGURE 8.9 Atomic hydrogen produces a series of
characteristic line spectra in the ultraviolet, visible, and infrared applying the quantum concept to a solar system model of the
parts of the total spectrum. The visible light spectra always consist atom. He began by considering the single hydrogen electron
of two violet lines, a blue-green line, and a bright red line. to be a single “planet” revolving in a circular orbit around
8-7 CHAPTER 8 Atoms and Periodic Properties 209