
Page 607 - 9780077418427.pdf
P. 607
/Volume/201/MHDQ233/tat78194_disk1of1/0073378194/tat78194_pagefiles
tiL12214_ch23_565-596.indd Page 584 9/23/10 11:07 AM user-f465
tiL12214_ch23_565-596.indd Page 584 9/23/10 11:07 AM user-f465 /Volume/201/MHDQ233/tat78194_disk1of1/0073378194/tat78194_pagefile
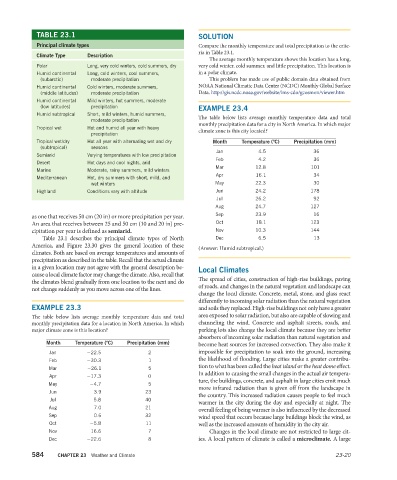
TABLE 23.1 SOLUTION
Principal climate types Compare the monthly temperature and total precipitation to the crite-
ria in Table 23.1.
Climate Type Description
The average monthly temperature shows this location has a long,
Polar Long, very cold winters, cold summers, dry very cold winter, cold summer, and little precipitation. This location is
Humid continental Long, cold winters, cool summers, in a polar climate.
(subarctic) moderate precipitation This problem has made use of public domain data obtained from
Humid continental Cold winters, moderate summers, NOAA National Climatic Data Center (NCDC) Monthly Global Surface
(middle latitudes) moderate precipitation Data. http://gis.ncdc.noaa.gov/website/ims-cdo/gcosmon/viewer.htm
Humid continental Mild winters, hot summers, moderate
(low latitudes) precipitation EXAMPLE 23.4
Humid subtropical Short, mild winters, humid summers,
moderate precipitation The table below lists average monthly temperature data and total
monthly precipitation data for a city in North America. In which major
Tropical wet Hot and humid all year with heavy climate zone is this city located?
precipitation
Tropical wet/dry Hot all year with alternating wet and dry Month Temperature (°C) Precipitation (mm)
(subtropical) seasons
Jan 4.5 36
Semiarid Varying temperatures with low precipitation
Feb 4.2 36
Desert Hot days and cool nights, arid
Mar 12.8 101
Marine Moderate, rainy summers, mild winters
Apr 16.1 34
Mediterranean Hot, dry summers with short, mild, and
wet winters May 22.3 30
Highland Conditions vary with altitude Jun 24.2 178
Jul 26.2 92
Aug 24.7 127
as one that receives 50 cm (20 in) or more precipitation per year. Sep 23.9 16
An area that receives between 25 and 50 cm (10 and 20 in) pre- Oct 18.1 123
cipitation per year is defined as semiarid. Nov 10.3 144
Table 23.1 describes the principal climate types of North Dec 6.5 13
America, and Figure 23.30 gives the general location of these
(Answer: Humid subtropical.)
climates. Both are based on average temperatures and amounts of
precipitation as described in the table. Recall that the actual climate
in a given location may not agree with the general description be- Local Climates
cause a local climate factor may change the climate. Also, recall that
The spread of cities, construction of high-rise buildings, paving
the climates blend gradually from one location to the next and do
of roads, and changes in the natural vegetation and landscape can
not change suddenly as you move across one of the lines.
change the local climate. Concrete, metal, stone, and glass react
differently to incoming solar radiation than the natural vegetation
EXAMPLE 23.3 and soils they replaced. High-rise buildings not only have a greater
The table below lists average monthly temperature data and total area exposed to solar radiation, but also are capable of slowing and
monthly precipitation data for a location in North America. In which channeling the wind. Concrete and asphalt streets, roads, and
major climate zone is this location? parking lots also change the local climate because they are better
absorbers of incoming solar radiation than natural vegetation and
Month Temperature (°C) Precipitation (mm) become heat sources for increased convection. They also make it
Jan −22.5 2 impossible for precipitation to soak into the ground, increasing
Feb −30.3 1 the likelihood of flooding. Large cities make a greater contribu-
tion to what has been called the heat island or the heat dome effect.
Mar −26.1 5
In addition to causing the small changes in the actual air tempera-
Apr −17.3 0
ture, the buildings, concrete, and asphalt in large cities emit much
May −4.7 5
more infrared radiation than is given off from the landscape in
Jun 3.9 23
the country. This increased radiation causes people to feel much
Jul 5.8 40
warmer in the city during the day and especially at night. The
Aug 7.0 21
overall feeling of being warmer is also influenced by the decreased
Sep 0.6 32 wind speed that occurs because large buildings block the wind, as
Oct −5.8 11 well as the increased amounts of humidity in the city air.
Nov −16.6 7 Changes in the local climate are not restricted to large cit-
Dec −22.6 8 ies. A local pattern of climate is called a microclimate. A large
584 CHAPTER 23 Weather and Climate 23-20