
Page 602 - 9780077418427.pdf
P. 602
/Volume/201/MHDQ233/tat78194_disk1of1/0073378194/tat78194_pagefiles
tiL12214_ch23_565-596.indd Page 579 9/23/10 11:07 AM user-f465
tiL12214_ch23_565-596.indd Page 579 9/23/10 11:07 AM user-f465 /Volume/201/MHDQ233/tat78194_disk1of1/0073378194/tat78194_pagefile
Katrina had sustained winds of 200 km/h (125 mi/h) as it
struck the shore, but other, smaller hurricanes have had stron-
ger sustained winds when they struck the shore. These include
• hurricane Camille, which hit Mississippi with 306 km/h
(190 mi/h) sustained winds on August 17, 1969;
• hurricane Andrew, which hit south Florida with 266 km/h
(165 mi/h) sustained winds on August 24, 1992; and
• hurricane Charley, which hit Punta Gorda, Florida, with
240 km/h (150 mi/h) sustained winds on August 13, 2009.*
CONCEPTS Applied
Hurricane Damage
Hurricanes are classified according to category and damage
to be expected. Here is the classification scheme:
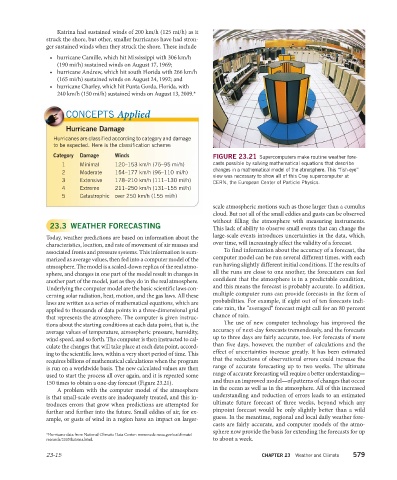
Category Damage Winds FIGURE 23.21 Supercomputers make routine weather fore-
1 Minimal 120–153 km/h (75–95 mi/h) casts possible by solving mathematical equations that describe
changes in a mathematical model of the atmosphere. This “fish-eye”
2 Moderate 154–177 km/h (96–110 mi/h)
view was necessary to show all of this Cray supercomputer at
3 Extensive 178–210 km/h (111–130 mi/h) CERN, the European Center of Particle Physics.
4 Extreme 211–250 km/h (131–155 mi/h)
5 Catastrophic over 250 km/h (155 mi/h)
scale atmospheric motions such as those larger than a cumulus
cloud. But not all of the small eddies and gusts can be observed
without filling the atmosphere with measuring instruments.
23.3 WEATHER FORECASTING This lack of ability to observe small events that can change the
Today, weather predictions are based on information about the large-scale events introduces uncertainties in the data, which,
characteristics, location, and rate of movement of air masses and over time, will increasingly affect the validity of a forecast.
associated fronts and pressure systems. This information is sum- To find information about the accuracy of a forecast, the
marized as average values, then fed into a computer model of the computer model can be run several different times, with each
atmosphere. The model is a scaled-down replica of the real atmo- run having slightly different initial conditions. If the results of
sphere, and changes in one part of the model result in changes in all the runs are close to one another, the forecasters can feel
another part of the model, just as they do in the real atmo sphere. confident that the atmosphere is in a predictable condition,
Underlying the computer model are the basic scientific laws con- and this means the forecast is probably accurate. In addition,
cerning solar radiation, heat, motion, and the gas laws. All these multiple computer runs can provide forecasts in the form of
laws are written as a series of mathematical equations, which are probabilities. For example, if eight out of ten forecasts indi-
applied to thousands of data points in a three-dimensional grid cate rain, the “averaged” forecast might call for an 80 percent
that represents the atmosphere. The computer is given instruc- chance of rain.
tions about the starting conditions at each data point, that is, the The use of new computer technology has improved the
average values of temperature, atmospheric pressure, humidity, accuracy of next-day forecasts tremendously, and the forecasts
wind speed, and so forth. The computer is then instructed to cal- up to three days are fairly accurate, too. For forecasts of more
culate the changes that will take place at each data point, accord- than five days, however, the number of calculations and the
ing to the scientific laws, within a very short period of time. This effect of uncertainties increase greatly. It has been estimated
requires billions of mathematical calculations when the program that the reductions of observational errors could increase the
is run on a worldwide basis. The new calculated values are then range of accurate forecasting up to two weeks. The ultimate
used to start the process all over again, and it is repeated some range of accurate forecasting will require a better understanding—
150 times to obtain a one-day forecast (Figure 23.21). and thus an improved model—of patterns of changes that occur
A problem with the computer model of the atmosphere in the ocean as well as in the atmosphere. All of this increased
is that small-scale events are inadequately treated, and this in- understanding and reduction of errors leads to an estimated
troduces errors that grow when predictions are attempted for ultimate future forecast of three weeks, beyond which any
further and further into the future. Small eddies of air, for ex- pinpoint forecast would be only slightly better than a wild
ample, or gusts of wind in a region have an impact on larger- guess. In the meantime, regional and local daily weather fore-
casts are fairly accurate, and computer models of the atmo-
sphere now provide the basis for extending the forecasts for up
*Hurricane data from National Climatic Data Center: www.ncdc.noaa.gov/oa/climate/
research/2005/katrina.html. to about a week.
23-15 CHAPTER 23 Weather and Climate 579