
Page 57 - TCS ICT Book 5
P. 57
The City School 2021-2022
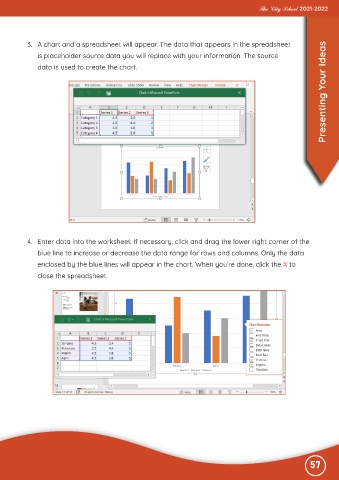
3. A chart and a spreadsheet will appear. The data that appears in the spreadsheet
is placeholder source data you will replace with your information. The source
data is used to create the chart. Presenting Your Ideas
4. Enter data into the worksheet. If necessary, click and drag the lower right corner of the
blue line to increase or decrease the data range for rows and columns. Only the data
enclosed by the blue lines will appear in the chart. When you’re done, click the X to
close the spreadsheet.
57