
Page 709 - MARSIUM'21 COMP OF PAPER
P. 709
688 Azifah & Hazarina (2022)
■ 4.0 DATA ANALYSIS AND FINDINGS
The questionnaire consists of dependent variable and independent variables that will be evaluated using five-likert scale. SPPS is used to test
the relationship between dependent variable and independent variables. There were 102 respondents fill in the questionnaire.
4.1 DEMOGRAPHIC ANALYSIS
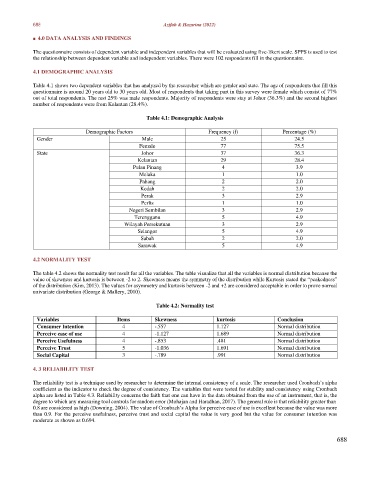
Table 4.1 shows two dependent variables that has analyzed by the researcher which are gender and state. The age of respondents that fill this
questionnaire is around 20 years old to 30 years old. Most of respondents that taking part in this survey were female which consist of 77%
out of total respondents. The rest 25% was male respondents. Majority of respondents were stay at Johor (36.3%) and the second highest
number of respondents were from Kelantan (28.4%).
Table 4.1: Demographic Analysis
Demographic Factors Frequency (f) Percentage (%)
Gender Male 25 24.5
Female 77 75.5
State Johor 37 36.3
Kelantan 29 28.4
Pulau Pinang 4 3.9
Melaka 1 1.0
Pahang 2 2.0
Kedah 2 2.0
Perak 3 2.9
Perlis 1 1.0
Negeri Sembilan 3 2.9
Terengganu 5 4.9
Wilayah Persekutuan 3 2.9
Selangor 5 4.9
Sabah 2 2.0
Sarawak 5 4.9
4.2 NORMALITY TEST
The table 4.2 shows the normality test result for all the variables. The table visualize that all the variables is normal distribution because the
value of skewness and kurtosis is between -2 to 2. Skewness means the symmetry of the distribution while Kurtosis stated the “peakedness”
of the distribution (Kim, 2013). The values for asymmetry and kurtosis between -2 and +2 are considered acceptable in order to prove normal
univariate distribution (George & Mallery, 2010).
Table 4.2: Normality test
Variables Items Skewness kurtosis Conclusion
Consumer Intention 4 -.557 1.127 Normal distribution
Perceive ease of use 4 -1.127 1.689 Normal distribution
Perceive Usefulness 4 -.853 .481 Normal distribution
Perceive Trust 5 -1.036 1.691 Normal distribution
Social Capital 3 -.789 .991 Normal distribution
4. 3 RELIABILITY TEST
The reliability test is a technique used by researcher to determine the internal consistency of a scale. The researcher used Cronbach’s alpha
coefficient as the indicator to check the degree of consistency. The variables that were tested for stability and consistency using Cronbach
alpha are listed in Table 4.3. Reliability concerns the faith that one can have in the data obtained from the use of an instrument, that is, the
degree to which any measuring tool controls for random error (Mohajan and Haradhan, 2017). The general rule is that reliability greater than
0.8 are considered as high (Downing, 2004). The value of Cronbach’s Alpha for perceive ease of use is excellent because the value was more
than 0.9. For the perceive usefulness, perceive trust and social capital the value is very good but the value for consumer intention was
moderate as shown as 0.694.
688