
Page 736 - MARSIUM'21 COMP OF PAPER
P. 736
715
4.0 RESULT AND ANALYSIS
The questionnaire created consists of the independent variables and dependent variable that will be assessed based on the questions of Likert
scale, which have five levels of agreement. The demographic factors were requiring multiple-choice questions. The data from the
questionnaire will be assessed by the researcher using Statistical Package for Social Science (SPSS) software. In order to test the relationship
between the independent variables (character archetypes, storytelling and language used) and the dependent variable (young people’s
behavior), there are several tests that will be used in the SPSS software.
4.1 DESCRIPTIVE ANALYSIS OF RESPONDENTS’ BACKGROUND
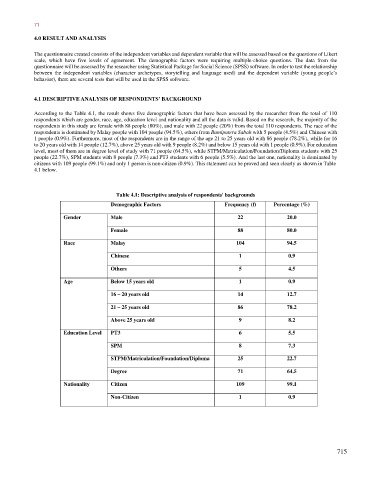
According to the Table 4.1, the result shows five demographic factors that have been assessed by the researcher from the total of 110
respondents which are gender, race, age, education level and nationality and all the data is valid. Based on the research, the majority of the
respondents in this study are female with 88 people (80%), and male with 22 people (20%) from the total 110 respondents. The race of the
respondents is dominated by Malay people with 104 people (94.5%), others from Bumiputera Sabah with 5 people (4.5%) and Chinese with
1 people (0.9%). Furthermore, most of the respondents are in the range of the age 21 to 25 years old with 86 people (78.2%), while for 16
to 20 years old with 14 people (12.7%), above 25 years old with 9 people (8.2%) and below 15 years old with 1 people (0.9%). For education
level, most of them are in degree level of study with 71 people (64.5%), while STPM/Matriculation/Foundation/Diploma students with 25
people (22.7%), SPM students with 8 people (7.3%) and PT3 students with 6 people (5.5%). And the last one, nationality is dominated by
citizens with 109 people (99.1%) and only 1 person is non-citizen (0.9%). This statement can be proved and seen clearly as shown in Table
4.1 below.
Table 4.1: Descriptive analysis of respondents' backgrounds
Demographic Factors Frequency (f) Percentage (%)
Gender Male 22 20.0
Female 88 80.0
Race Malay 104 94.5
Chinese 1 0.9
Others 5 4.5
Age Below 15 years old 1 0.9
16 – 20 years old 14 12.7
21 – 25 years old 86 78.2
Above 25 years old 9 8.2
Education Level PT3 6 5.5
SPM 8 7.3
STPM/Matriculation/Foundation/Diploma 25 22.7
Degree 71 64.5
Nationality Citizen 109 99.1
Non-Citizen 1 0.9
715