
Page 737 - MARSIUM'21 COMP OF PAPER
P. 737
716
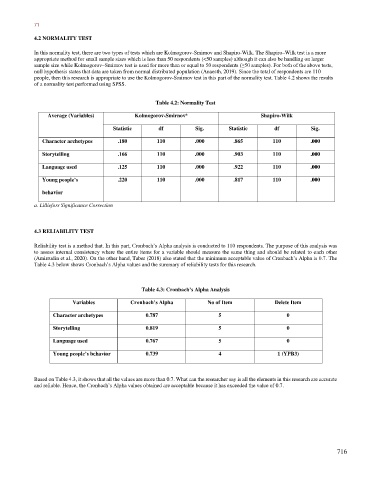
4.2 NORMALITY TEST
In this normality test, there are two types of tests which are Kolmogorov-Smirnov and Shapiro-Wilk. The Shapiro–Wilk test is a more
appropriate method for small sample sizes which is less than 50 respondents (<50 samples) although it can also be handling on larger
sample size while Kolmogorov–Smirnov test is used for more than or equal to 50 respondents (≥50 samples). For both of the above tests,
null hypothesis states that data are taken from normal distributed population (Anaesth, 2019). Since the total of respondents are 110
people, then this research is appropriate to use the Kolmogorov-Smirnov test in this part of the normality test. Table 4.2 shows the results
of a normality test performed using SPSS.
Table 4.2: Normality Test
a
Average (Variables) Kolmogorov-Smirnov Shapiro-Wilk
Statistic df Sig. Statistic df Sig.
Character archetypes .180 110 .000 .865 110 .000
Storytelling .166 110 .000 .903 110 .000
Language used .125 110 .000 .922 110 .000
Young people’s .220 110 .000 .817 110 .000
behavior
a. Lilliefors Significance Correction
4.3 RELIABILITY TEST
Reliability test is a method that. In this part, Cronbach’s Alpha analysis is conducted to 110 respondents. The purpose of this analysis was
to assess internal consistency where the entire items for a variable should measure the same thing and should be related to each other
(Amirrudin et al., 2020). On the other hand, Taber (2018) also stated that the minimum acceptable value of Cronbach’s Alpha is 0.7. The
Table 4.3 below shows Cronbach’s Alpha values and the summary of reliability tests for this research.
Table 4.3: Cronbach’s Alpha Analysis
Variables Cronbach’s Alpha No of Item Delete Item
Character archetypes 0.787 5 0
Storytelling 0.819 5 0
Language used 0.767 5 0
Young people’s behavior 0.739 4 1 (YPB3)
Based on Table 4.3, it shows that all the values are more than 0.7. What can the researcher say is all the elements in this research are accurate
and reliable. Hence, the Cronbach’s Alpha values obtained are acceptable because it has exceeded the value of 0.7.
716