
Page 738 - MARSIUM'21 COMP OF PAPER
P. 738
717
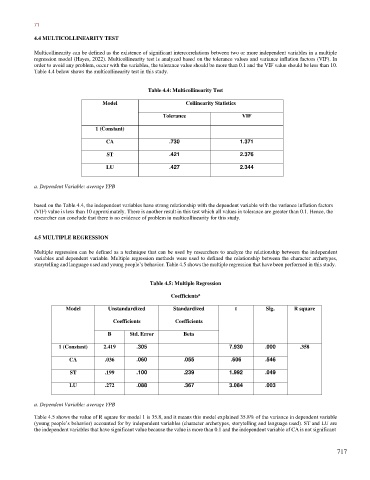
4.4 MULTICOLLINEARITY TEST
Multicollinearity can be defined as the existence of significant intercorrelations between two or more independent variables in a multiple
regression model (Hayes, 2022). Multicollinearity test is analyzed based on the tolerance values and variance inflation factors (VIF). In
order to avoid any problem, occur with the variables, the tolerance value should be more than 0.1 and the VIF value should be less than 10.
Table 4.4 below shows the multicollinearity test in this study.
Table 4.4: Multicollinearity Test
Model Collinearity Statistics
Tolerance VIF
1 (Constant)
CA .730 1.371
ST .421 2.376
LU .427 2.344
a. Dependent Variable: average YPB
based on the Table 4.4, the independent variables have strong relationship with the dependent variable with the variance inflation factors
(VIF) value is less than 10 approximately. There is another result in this test which all values in tolerance are greater than 0.1. Hence, the
researcher can conclude that there is no evidence of problem in multicollinearity for this study.
4.5 MULTIPLE REGRESSION
Multiple regression can be defined as a technique that can be used by researchers to analyze the relationship between the independent
variables and dependent variable. Multiple regression methods were used to defined the relationship between the character archetypes,
storytelling and language used and young people’s behavior. Table 4.5 shows the multiple regression that have been performed in this study.
Table 4.5: Multiple Regression
a
Coefficients
Model Unstandardized Standardized t Sig. R square
Coefficients Coefficients
B Std. Error Beta
1 (Constant) 2.419 .305 7.930 .000 .358
CA .036 .060 .055 .606 .546
ST .199 .100 .239 1.992 .049
LU .272 .088 .367 3.084 .003
a. Dependent Variable: average YPB
Table 4.5 shows the value of R square for model 1 is 35.8, and it means this model explained 35.8% of the variance in dependent variable
(young people’s behavior) accounted for by independent variables (character archetypes, storytelling and language used). ST and LU are
the independent variables that have significant value because the value is more than 0.1 and the independent variable of CA is not significant
717