
Page 867 - MARSIUM'21 COMP OF PAPER
P. 867
868
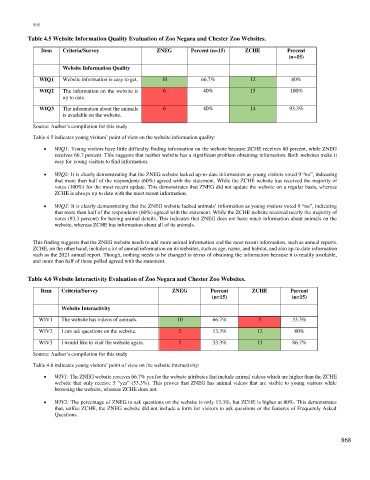
Table 4.5 Website Information Quality Evaluation of Zoo Negara and Chester Zoo Websites.
Item Criteria/Survey ZNEG Percent (n=15) ZCHE Percent
(n=15)
Website Information Quality
WIQ1 Website information is easy to get. 10 66.7% 12 80%
WIQ2 The information on the website is 6 40% 15 100%
up to date.
WIQ3 The information about the animals 6 40% 14 93.3%
is available on the website.
Source: Author’s compilation for this study
Table 4.5 indicates young visitors’ point of view on the website information quality:
• WIQ1: Young visitors have little difficulty finding information on the website because ZCHE receives 80 percent, while ZNEG
receives 66.7 percent. This suggests that neither website has a significant problem obtaining information. Both websites make it
easy for young visitors to find information.
• WIQ2: It is clearly demonstrating that the ZNEG website lacked up-to-date information as young visitors voted 9 “no”, indicating
that more than half of the respondents (60%) agreed with the statement. While the ZCHE website has received the majority of
votes (100%) for the most recent update. This demonstrates that ZNEG did not update the website on a regular basis, whereas
ZCHE is always up to date with the most recent information.
• WIQ3: It is clearly demonstrating that the ZNEG website lacked animals’ information as young visitors voted 9 “no”, indicating
that more than half of the respondents (60%) agreed with the statement. While the ZCHE website received nearly the majority of
votes (93.3 percent) for having animal details. This indicates that ZNEG does not have much information about animals on the
website, whereas ZCHE has information about all of its animals.
This finding suggests that the ZNEG website needs to add more animal information and the most recent information, such as annual reports.
ZCHE, on the other hand, includes a lot of animal information on its websites, such as age, name, and habitat, and also up-to-date information
such as the 2021 annual report. Though, nothing needs to be changed in terms of obtaining the information because it is readily available,
and more than half of those polled agreed with the statement.
Table 4.6 Website Interactivity Evaluation of Zoo Negara and Chester Zoo Websites.
Item Criteria/Survey ZNEG Percent ZCHE Percent
(n=15) (n=15)
Website Interactivity
WIV1 The website has videos of animals. 10 66.7% 5 33.3%
WIV2 I can ask questions on the website. 2 13.3% 12 80%
WIV3 I would like to visit the website again. 5 33.3% 13 86.7%
Source: Author’s compilation for this study
Table 4.6 indicates young visitors’ point of view on the website interactivity:
• WIV1: The ZNEG website receives 66.7% yes for the website attributes that include animal videos which are higher than the ZCHE
website that only receive 5 “yes” (53.3%). This proves that ZNEG has animal videos that are visible to young visitors while
browsing the website, whereas ZCHE does not.
• WIV2: The percentage of ZNEG to ask questions on the website is only 13.3%, but ZCHE is higher at 80%. This demonstrates
that, unlike ZCHE, the ZNEG website did not include a form for visitors to ask questions or the features of Frequently Asked
Questions.
868